Edited 18th Feb 17, to add section on adding a custom name for anonymous middleware
In a recent post I took a look at the IStartupFilter interface, a little known feature that can be used to add middleware to your configured pipeline through a different route than the standard Configure method.
I have also previously looked at the DiagnosticSource logging framework, which provides a mechanism for logging rich data, as opposed to the strings that are logged using the ILogger infrastructure.
In this post, I will take a look at the Microsoft.AspNetCore.MiddlewareAnalysis package, which uses an IStartupFilter and DiagnosticSource to provide insights into your middleware pipeline.
Analysing your middleware pipeline
Before we dig into details, lets take a look at what you can expect when you use the MiddlewareAnalysis package in your solution.
I've started with a simple 'Hello world' ASP.NET Core application that just prints to the console for every request. The initial Startup.Configure method looks like the following:
public void Configure(IApplicationBuilder app, IHostingEnvironment env, ILoggerFactory loggerFactory)
{
    loggerFactory.AddConsole();

    if (env.IsDevelopment())
    {
        app.UseDeveloperExceptionPage();
    }

    app.Run(async (context) =>
    {
        await context.Response.WriteAsync("Hello World!");
    });
}
When you run the app, you just get the Hello World as expected:
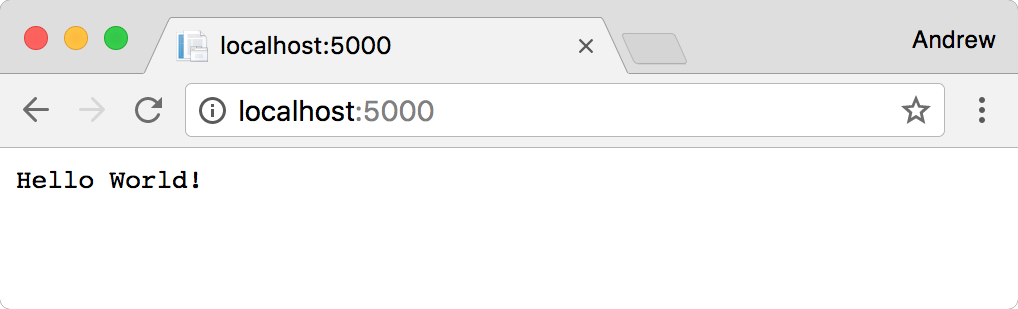
By default, we have a console logger set up, so the request to the root url will provide some details about the request:
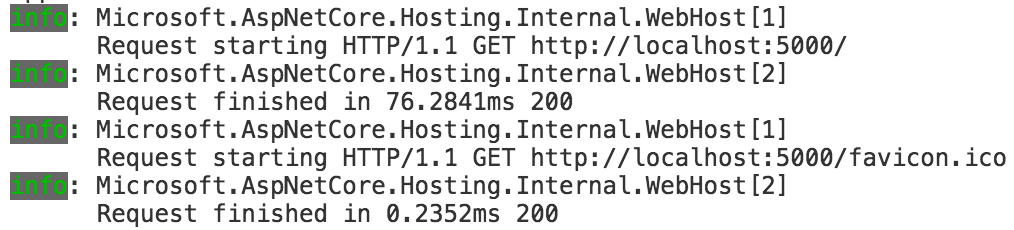
Nothing particularly surprising there. The interesting stuff happens after we've added the analysis filter to our project. After doing so, we'll see a whole load of additional information is logged to the console, describing when each of the middleware components start and stop:

At first blush, this might not seem that useful, it doesn't appear to be logging anything especially useful. But as you'll see later, the real power comes from using the DiagnosticSource adapter, which allows you to log arbitrary details.
It could also be very handy in diagnosing complex branching middleware pipelines, when trying to figure out why a particular request takes a given route through your app.
Now you've seen what to expect, we'll add middleware analysis to our pipeline.
1. Add the required packages
There are a couple of packages needed for this example. The AnalysisStartupFilter we are going to use from the Microsoft.AspNetCore.MiddlewareAnalysis package writes events using DiagnosticSource. One of the easiest ways to consume these events is using the Microsoft.Extensions.DiagnosticAdapter package, as you'll see shortly.
First add the MiddlewareAnalysis and DiagnosticAdapter packages to either your project.json or .csproj file (depending if you've moved to the new msbuild format):
{
  "dependencies" : {
  ...
  "Microsoft.AspNetCore.MiddlewareAnalysis": "1.1.0",
  "Microsoft.Extensions.DiagnosticAdapter": "1.1.0"
  }
}
Next, we will create an adapter to consume the events generated by the MiddlewareAnalysis package.
2. Creating a diagnostic adapter
In order to consume events from a DiagnosticSource, we need to subscribe to the event stream. For further details on how DiagnosticSource works, check out my previous post or the user guide.
A diagnostic adapter is typically a standard POCO class with methods for each event you are interested in, decorated with a DiagnosticNameAttribute.
You can create a simple adapter for the MiddlewareAnalysis package such as the following (taken from the sample on GitHub):
public class TestDiagnosticListener
{
    [DiagnosticName("Microsoft.AspNetCore.MiddlewareAnalysis.MiddlewareStarting")]
    public virtual void OnMiddlewareStarting(HttpContext httpContext, string name)
    {
        Console.WriteLine($"MiddlewareStarting: {name}; {httpContext.Request.Path}");
    }

    [DiagnosticName("Microsoft.AspNetCore.MiddlewareAnalysis.MiddlewareException")]
    public virtual void OnMiddlewareException(Exception exception, string name)
    {
        Console.WriteLine($"MiddlewareException: {name}; {exception.Message}");
    }

    [DiagnosticName("Microsoft.AspNetCore.MiddlewareAnalysis.MiddlewareFinished")]
    public virtual void OnMiddlewareFinished(HttpContext httpContext, string name)
    {
        Console.WriteLine($"MiddlewareFinished: {name}; {httpContext.Response.StatusCode}");
    }
}
This adapter creates a separate method for each event that the analysis middleware exposes:
"Microsoft.AspNetCore.MiddlewareAnalysis.MiddlewareStarting""Microsoft.AspNetCore.MiddlewareAnalysis.MiddlewareFinished""Microsoft.AspNetCore.MiddlewareAnalysis.MiddlewareException"
Each event exposes a particular set of named parameters which you can use in your method. For example, the MiddlewareStarting event exposes a number of parameters, though we are only using two in our TestDiagnosticListener methods :
string name: The name of the currently executing middlewareHttpContext httpContext: TheHttpContextfor the current requestGuid instanceId: A unique guid for the analysis middlewarelong timestamp: The timestamp at which the middleware started to run, given byStopwatch.GetTimestamp()
Warning: The name of the methods in our adapter are not important, but the name of the parameters are. If you don't name them correctly, you'll get exceptions or nulls passed to your methods at runtime.
The fact that the whole HttpContext is available to the logger is one of the really powerful points of the DiagnosticSource infrastructure. Instead of the decision about what to log being made at the calling site, it is made by the logging code itself, which has access to the full context of the event.
In the example, we are doing some very trivial logging, writing straight to the console and just noting down basic features of the request like the request path and status code, but the possibility is there to do far more interesting things as needs be: inspecting headers; query parameters; writing to other data sinks etc.
With an adapter created we can look at wiring it up in our application.
3. Add the necessary services
As with most standard middleware packages in ASP.NET Core, you must register some required services with the dependency injection container in ConfigureServices. Luckily, as is convention, the package contains an extension method to make this easy:
public void ConfigureServices(IServiceCollection services)
{
    services.AddMiddlewareAnalysis();
}
With the services registered, the final step is to wire up our listener.
4. Wiring up the diagnostic listener
In order for the TestDiagnosticListener we created in step 2. to collect events, we must register it with a DiagnosticListener. Again, check the user guide if you are interested in the details.
public void Configure(IApplicationBuilder app, DiagnosticListener diagnosticListener, IHostingEnvironment env, ILoggerFactory loggerFactory)
{
    var listener = new TestDiagnosticListener();
    diagnosticListener.SubscribeWithAdapter(listener);

    // ... remainder of the existing Configure method
}
The DiagnosticListener can be injected into the Configure method using standard dependency injection, and an instance of the TestDiagnosticListener can just be created directly.
The registering of our listener is achieved using the SubscribeWithAdapter extension method that is exposed by the Microsoft.Extensions.DiagnosticAdapter package. This performs all the wiring up of the TestDiagnosticListener methods to the DiagnosticListener for us.
That is all there is to it. No additional middleware to add or modifying of our pipeline, just add the listener and give it a test!
5. Run your application and look at the output
With everything setup, you can run your application, make a request, and check the output. If all is setup correctly, you should see the same "Hello World" response, but your console will be peppered with extra details about the middleware being run:
Understanding the analysis output
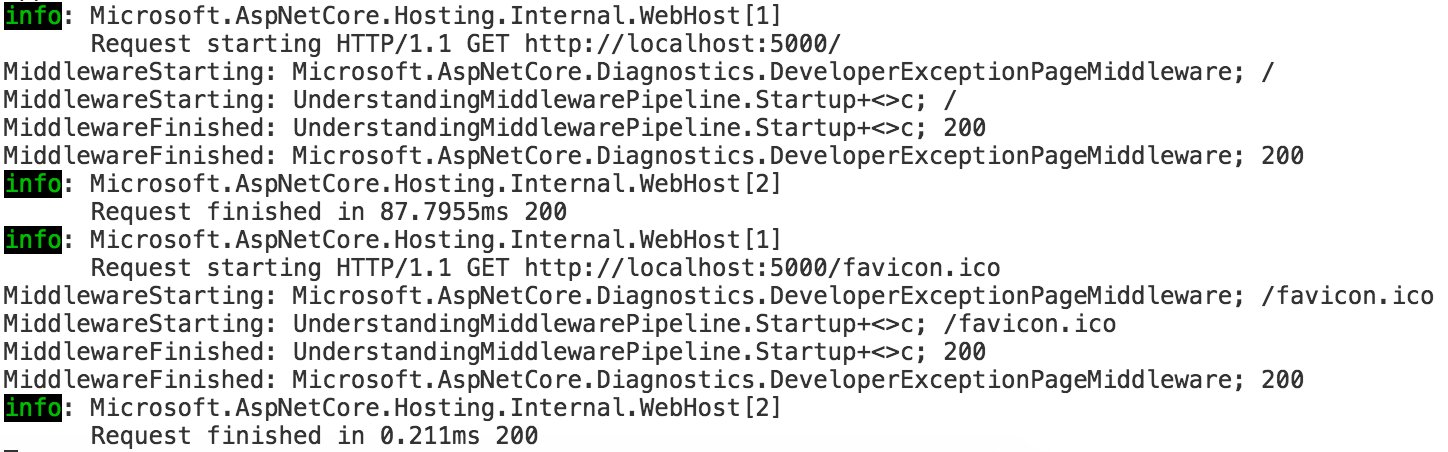
Assuming this has all worked correctly you should have a series of "MiddlewareStarting" and "MiddlewareFinished" entries in your console. In my case, running in a development environment, and ignoring the Ilogger messages, my sample app gives me the following output when I make a request to the root path /:
MiddlewareStarting: Microsoft.AspNetCore.Diagnostics.DeveloperExceptionPageMiddleware; /
MiddlewareStarting: UnderstandingMiddlewarePipeline.Startup+<>c; /
MiddlewareFinished: UnderstandingMiddlewarePipeline.Startup+<>c; 200
MiddlewareFinished: Microsoft.AspNetCore.Diagnostics.DeveloperExceptionPageMiddleware; 200
There are two calls to "MiddlewareStarting" in here, and two corresponding calls to "MiddlewareFinished".
The first call is fairly self explanatory, as it lists the name of the middleware as DeveloperExceptionPageMiddleware. This was the first middleware I added to my pipeline, so it was the first middleware called for the request.
The second call is slightly more cryptic, as it lists the name of the middleware as UnderstandingMiddlewarePipeline.Startup+<>c. This is because I used an inline app.Run method to generate the "Hello world" response in the browser (as I showed right at the beginning of the post).
Using app.Run adds an additional logical piece of middleware to the pipeline, one that executes the provided lambda. That lambda obviously doesn't have a friendly name, so the analysis middleware package passes the automatically generated type name to the listener.
As expected, the MiddlewareFinished logs occur in the reverse order to the MiddlewareStarting logs, as the response passes back down through the middleware pipeline. At each stage it lists the status code for the request generated by the completing middleware. This would allows you to see, for example, at exactly which point in the pipeline the status code for a request switched from 200 to an error.
Adding a custom name for anonymous middleware
While it's fairly obvious what the anonymous middleware is in this case, what if you had used multiple app.Run or app.Use calls in your method? It could be confusing if your pipeline has multiple branches or generally anonymous methods. This rather defeats the point of using the middleware analysis middleware!
Luckily, there's an easy way to give a name to these anonymous methods if you wish, by setting a property on the IApplicationBulider called "analysis.NextMiddlewareName". For example, we could rewrite our middleware pipeline as the following:
public void Configure(IApplicationBuilder app, IHostingEnvironment env, ILoggerFactory loggerFactory)
{
    loggerFactory.AddConsole();

    if (env.IsDevelopment())
    {
        app.UseDeveloperExceptionPage();
    }

    app.Properties["analysis.NextMiddlewareName"] = "HelloWorld";
    app.Run(async (context) =>
    {
        await context.Response.WriteAsync("Hello World!");
    });
}
If we ran the request again with the addition of our property, the logs would look like the following:
MiddlewareStarting: Microsoft.AspNetCore.Diagnostics.DeveloperExceptionPageMiddleware; /
MiddlewareStarting: HelloWorld; /
MiddlewareFinished: HelloWorld; 200
MiddlewareFinished: Microsoft.AspNetCore.Diagnostics.DeveloperExceptionPageMiddleware; 200
Much clearer!
Listening for errors
Previously I said that the analysis middleware generates three different events, one of which is MiddlewareException. To see this in action, the easiest approach is to view the demo for the middleware analysis package. This lets you test each of the different types of events you might get using simple links:
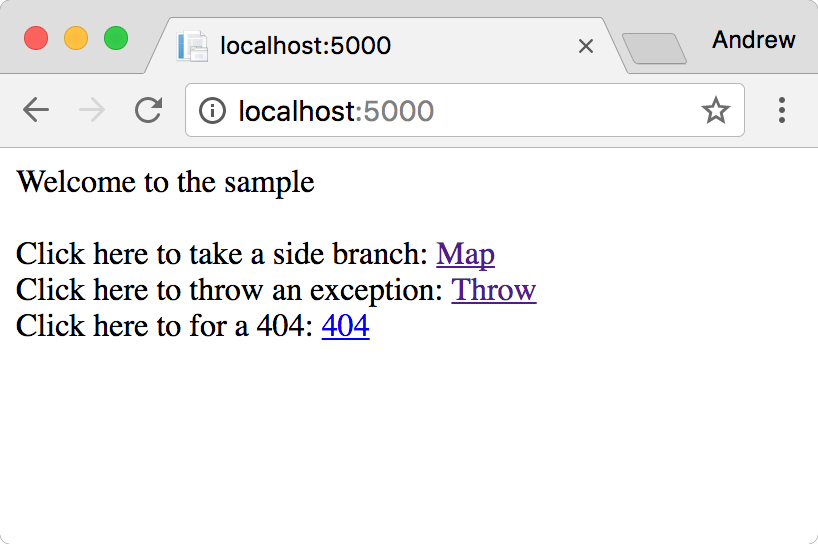
By clicking on the "throw" option, the sample app will throw an exception as part of the middleware pipeline execution, and you can inspect the logs. If you do, you'll see a number of "MiddlewareException" entries. Obviously the details shown in the sample are scant, but as I've already described, you have a huge amount of flexibility in your diagnostic adapter to log any details you need:
MiddlewareStarting: Microsoft.AspNetCore.Diagnostics.DeveloperExceptionPageMiddleware; /throw
MiddlewareStarting: Microsoft.AspNetCore.Builder.UseExtensions+<>c__DisplayClass0_0; /throw
MiddlewareStarting: Microsoft.AspNetCore.Builder.Extensions.MapMiddleware; /throw
MiddlewareStarting: MiddlewareAnaysisSample.Startup+<>c__DisplayClass1_0; /throw
MiddlewareStarting: Microsoft.AspNetCore.Builder.Extensions.MapMiddleware; /throw
MiddlewareStarting: MiddlewareAnaysisSample.Startup+<>c;
MiddlewareException: MiddlewareAnaysisSample.Startup+<>c; Application Exception
MiddlewareException: Microsoft.AspNetCore.Builder.Extensions.MapMiddleware; Application Exception
MiddlewareException: MiddlewareAnaysisSample.Startup+<>c__DisplayClass1_0; Application Exception
MiddlewareException: Microsoft.AspNetCore.Builder.Extensions.MapMiddleware; Application Exception
MiddlewareException: Microsoft.AspNetCore.Builder.UseExtensions+<>c__DisplayClass0_0; Application Exception
Hopefully you now have a feel for the benefit of being able to get such detailed insight into exactly what your middleware pipeline is doing. I really encourage you to have a play with the sample app, and tweak it to see how powerful it could be for diagnosing issues in your own apps.
Event parameters reference
One of the slightly annoying things with the DiagnosticSource infrastructure is the lack of documentation around the events and parameters that a package exposes. You can always look through the source code but that's not exactly user friendly.
As of writing, the current version of Microsoft.AspNetCore.MiddlewareAnalysis is 1.1.0, which exposes three events, with the following parameters:
"Microsoft.AspNetCore.MiddlewareAnalysis.MiddlewareStarting"string name: The name of the currently executing middlewareHttpContext httpContext: TheHttpContextfor the current requestGuid instanceId: A unique guid for the analysis middlewarelong timestamp: The current ticks timestamp at which the middleware started to run, given byStopwatch.GetTimestamp()"Microsoft.AspNetCore.MiddlewareAnalysis.MiddlewareFinished"string name: The name of the currently executing middlewareHttpContext httpContext: TheHttpContextfor the current requestGuid instanceId: A unique guid for the analysis middlewarelong timestamp: The timestamp at which the middleware finished runninglong duration: The duration in ticks that the middleware took to run, given by the finish timestamp - the start timestamp."Microsoft.AspNetCore.MiddlewareAnalysis.MiddlewareException"string name: The name of the currently executing middlewareHttpContext httpContext: TheHttpContextfor the current requestGuid instanceId: A unique guid for the analysis middlewarelong timestamp: The timestamp at which the middleware finished runninglong duration: The duration in ticks that the middleware took to run, given by the finish timestamp - the start timestamp.Exception ex: The exception that occurred during execution of the middleware
Given the names of the events and the parameters must match these values, if you find you logger isn't working, it's worth checking back in the source code to see if things have changed.
Note: The event names must be an exact match, including case, but the parameter names are not case sensitive.
Under the hood
This post is already pretty long, so I'll save the details of how the middleware analysis filter works for a later post, but at it's core it is using two pieces of infrastructure, IStartupFilter and DiagnosticSource. Of course, if you can't wait, you can always check out the source code on GitHub!