In my previous post, I showed how you can install Docker Desktop for Windows using WSL 2. In this post I show how to enable Kubernetes support, and how to deploy the Kubernetes Dashboard to give your local Kubernetes cluster a friendly GUI.
Do you need Kubernetes?
Your first question before going down this route should be "do I need Kubernetes?". Kubernetes has become the defacto container orchestrator for production workloads, but that doesn't mean you necessarily need it. Especially for local development.
In my experience, the biggest wins from Docker come from the isolation it gives you from your host system. You don't need Kubernetes to benefit from that. Even if you find you start needing to orchestrate containers locally, I'd recommend Docker Compose as a simpler alternative to Kubernetes.
If you're in the .NET space, then Project Tye is another great option which should give a simpler onboarding than Kubernetes.
That said, if you're deploying to production on Kubernetes then there's considerable value to being able to run and test your code in a similar environment locally. The downside to that is it means running your own Kubernetes cluster locally… Luckily, Docker Desktop can take care of that for you!
For an introduction to Kubernetes, or for advice on deploying ASP.NET Core applications to Kubernetes, see my 12 part series.
Enabling Kubernetes on Docker Desktop for Windows
Kubernetes can run on top of Docker (currently), and Docker Desktop for Windows (or Mac) includes support for running a Kubernetes cluster for you, without you having to manually configure the cluster yourself. This is very convenient, as you'll see shortly!
There are many other ways to run Kubernetes locally, such as using kind or minikube, but if you're already using Docker Desktop, then this is probably the easiest approach.
You only need to do two things to get Kubernetes running in Docker Desktop:
- Install WSL 2 and Docker Desktop for Windows
- Check Enable Kubernetes in Docker Desktop
Simple right!
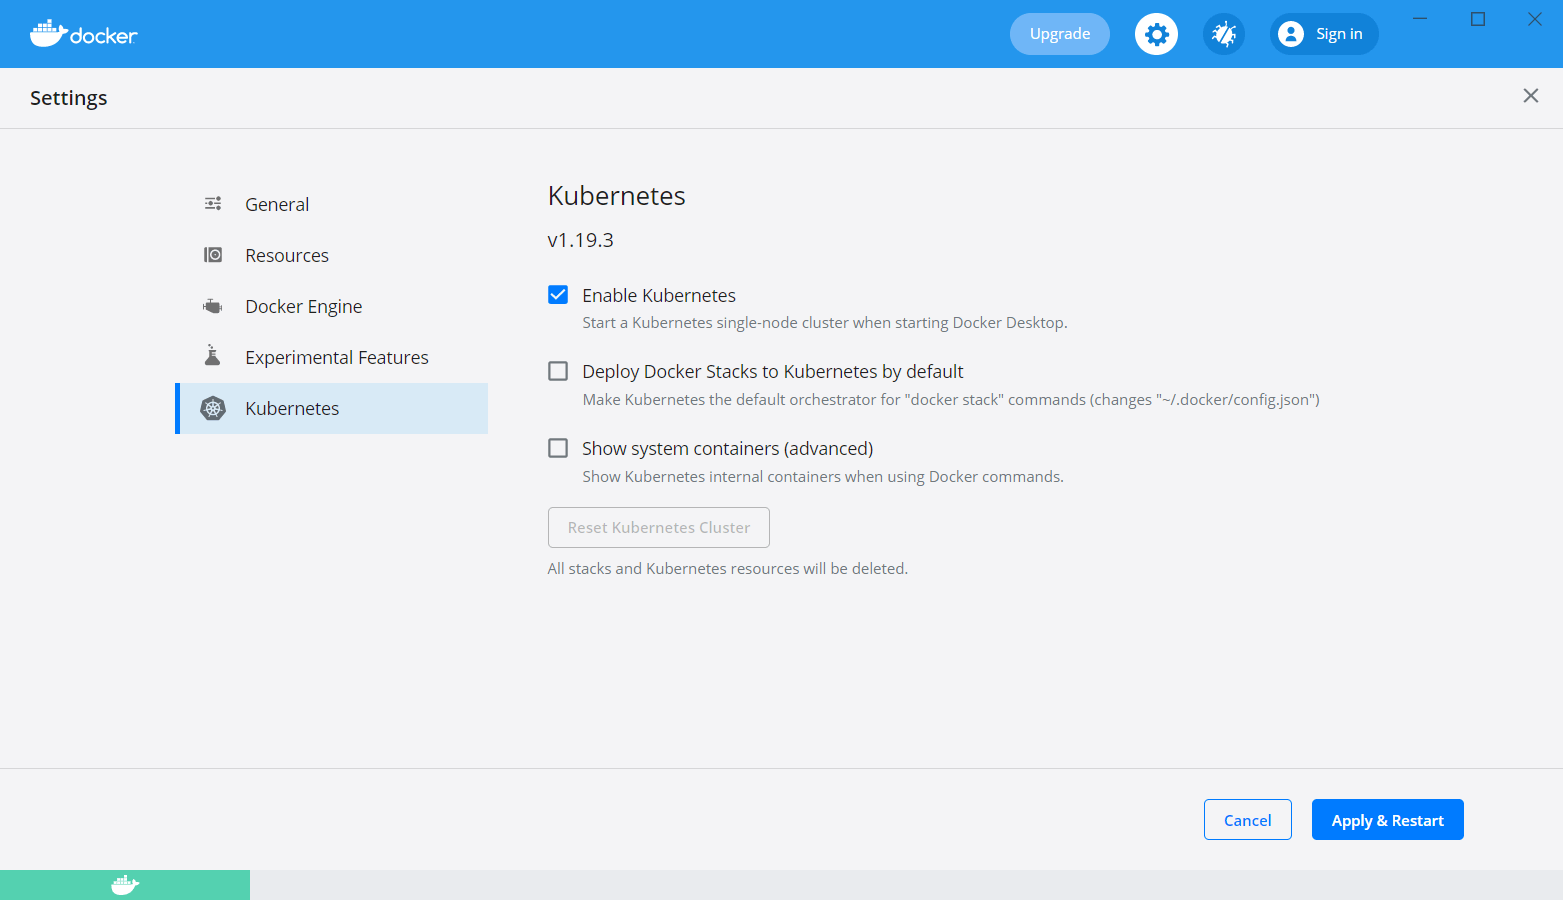
After you've followed the instructions in my previous post to install WSL 2 and Docker Desktop, open up the settings screen (by clicking the cog in the top right). Navigate to the Kubernetes tab, and check Enable Kubernetes:
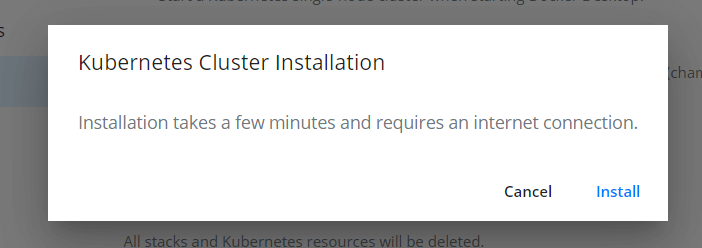
Click Apply & Restart, and you'll get a popup advising you that you need an internet connection. Click Install to continue.
Docker Desktop pulls all the required images in the background, and starts setting up your cluster. In the bottom left of the screen you can see the little Kubernetes symbol has appeared, but it's orange to indicating it's still starting up.
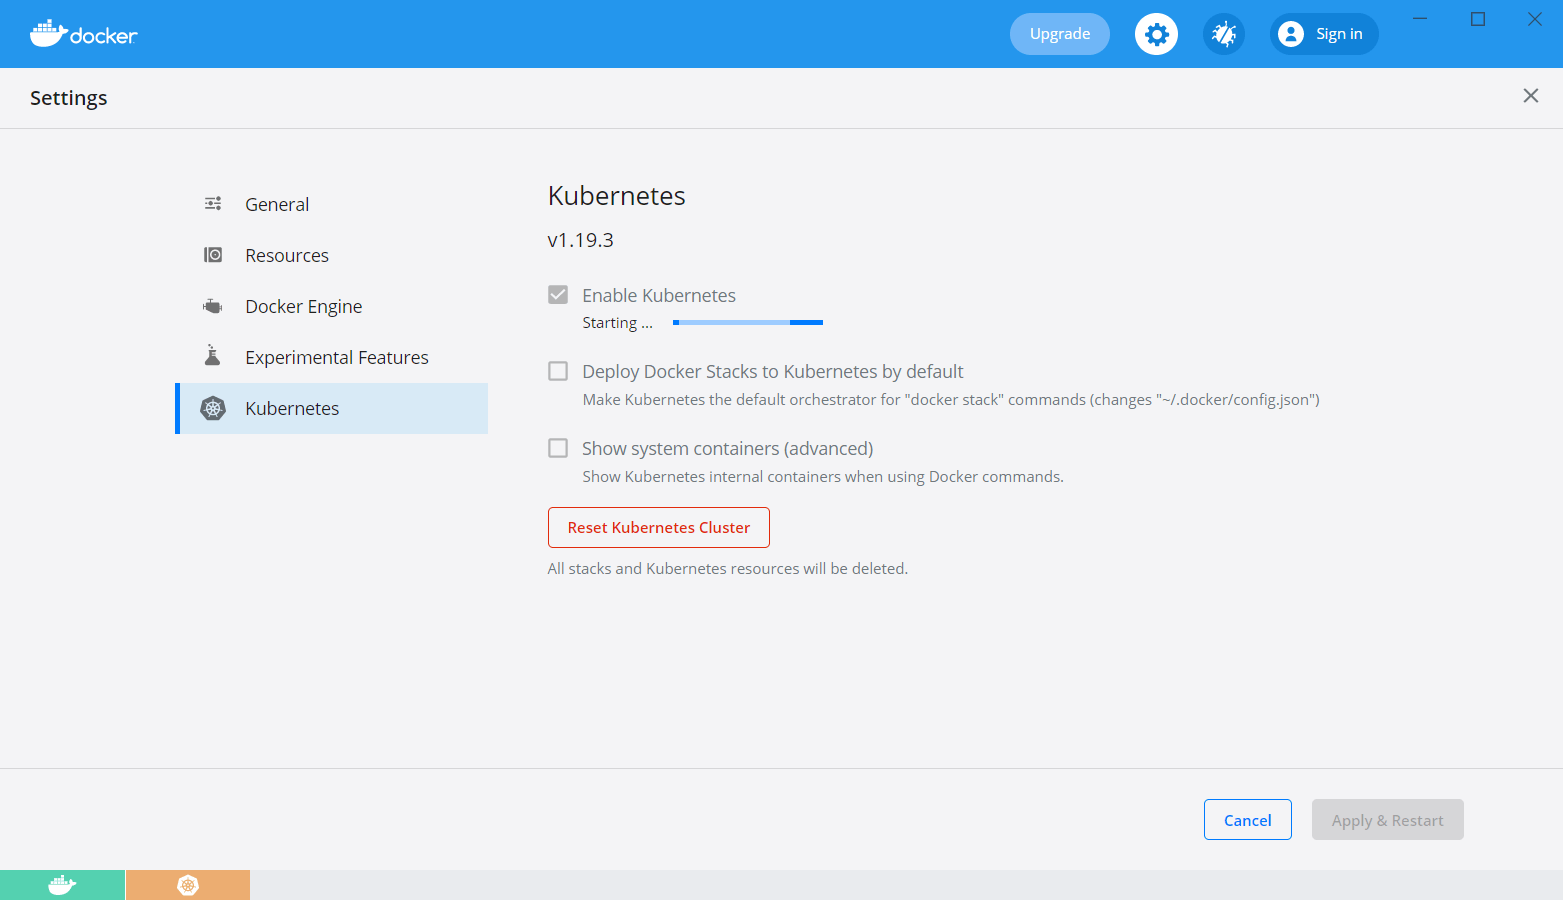
Once that turns green, you have Kubernetes up and running! Click Cancel to exit the settings.
You can now start deploying Kubernetes resources to your cluster. From the command line, you can run kubectl commands. For example kubectl get pods -n kube-system shows you some of the pods that are part of the Kubernetes system:
>  kubectl get pods -n kube-system
NAME                                     READY   STATUS    RESTARTS   AGE
coredns-f9fd979d6-5f794                  1/1     Running   1          20h
coredns-f9fd979d6-gmpf9                  1/1     Running   1          20h
etcd-docker-desktop                      1/1     Running   1          20h
kube-apiserver-docker-desktop            1/1     Running   1          20h
kube-controller-manager-docker-desktop   1/1     Running   1          20h
kube-proxy-qgg97                         1/1     Running   1          20h
kube-scheduler-docker-desktop            1/1     Running   2          20h
storage-provisioner                      1/1     Running   1          20h
vpnkit-controller                        1/1     Running   1          20h
Docker Desktop doesn't list the pods in these containers in its UI, but they're there!
If you want to see these containers listed in the Containers/Apps section of Docker Desktop, enable the Show System Containers (Advanced) checkbox in Settings.
In fact, this is the main downside with the Kubernetes support in Docker Desktop. As I showed in my previous post, Docker Desktop gives a nice UI with convenience methods for shelling into containers etc. There isn't an equivalent out-of-the-box experience for Kubernetes.
Installing Kubernetes Dashboard to get a nice UI
It would be really nice if Docker Desktop included a GUI for Kubernetes out of the box, but we can get a similar experience using Kubernetes Dashboard. This project provides a Web UI for managing your cluster, providing an easy way to see an overview of your cluster, and even for editing and exec-ing into containers.
To install the Kubernetes Dashboard, open a PowerShell terminal, and run the following:
kubectl apply -f https://raw.githubusercontent.com/kubernetes/dashboard/v2.2.0/aio/deploy/recommended.yaml
This command downloads a file from the internet and runs it on your computer. You should always be wary of doing that, inspect the file first and make sure you're happy using it!
This command downloads the deployment manifest and applies it to your cluster, you should see something like the following:
namespace/kubernetes-dashboard created
serviceaccount/kubernetes-dashboard created
service/kubernetes-dashboard created
...
service/dashboard-metrics-scraper created
deployment.apps/dashboard-metrics-scraper created
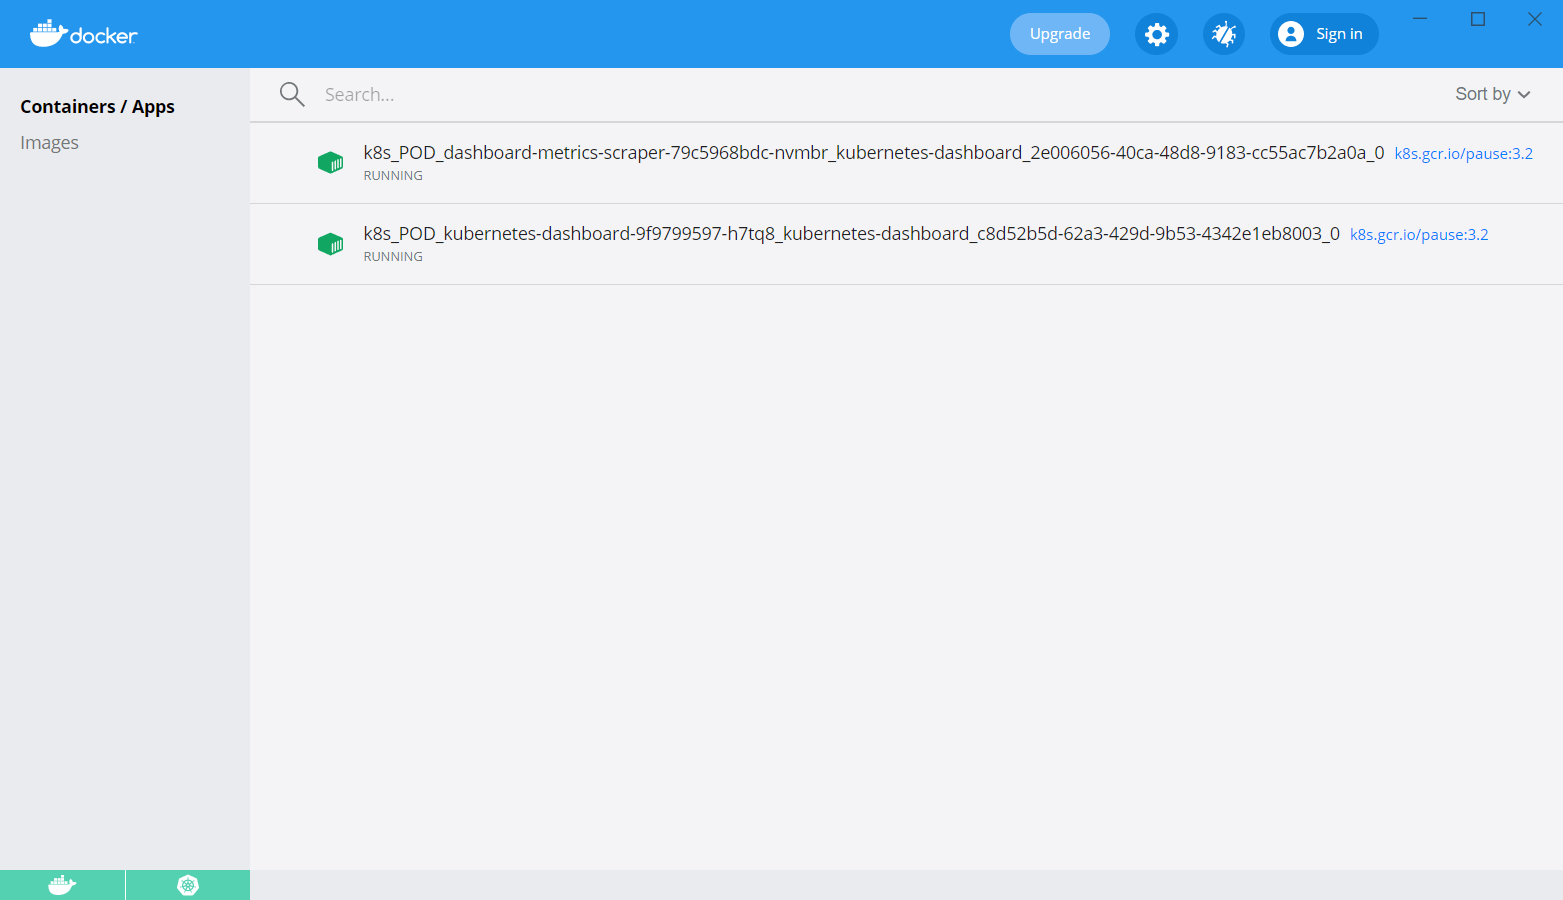
If you take a look in Docker Desktop, you'll see some containers are running, with long names. These are the containers running as part of the Kubernetes Dashboard pods
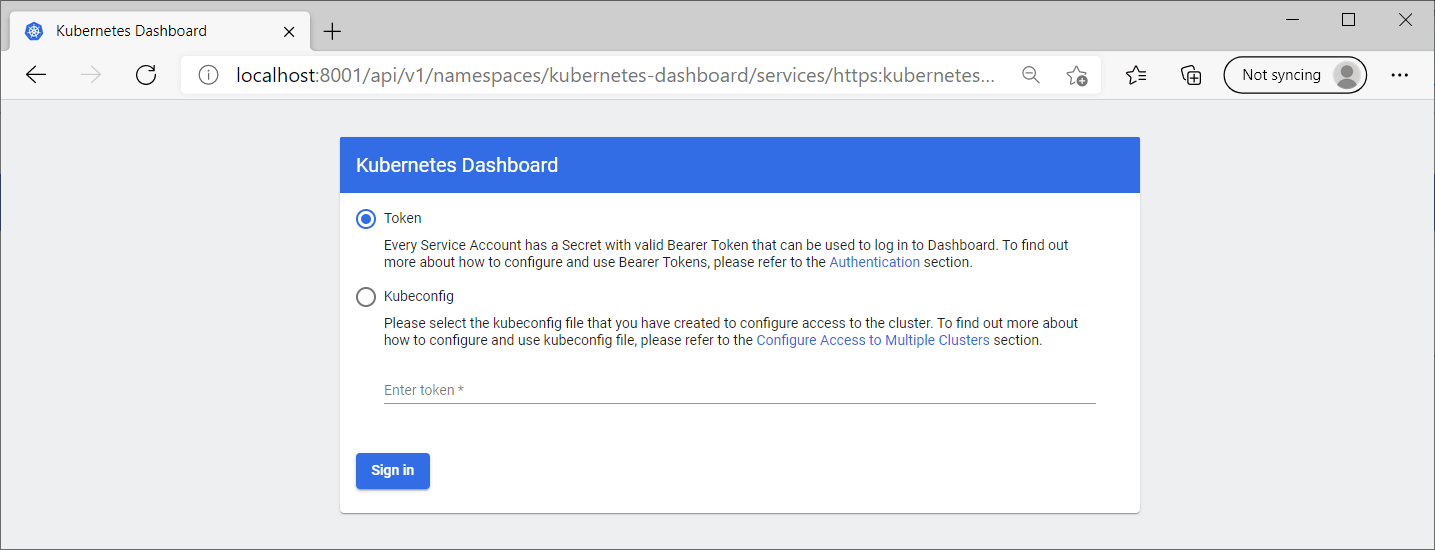
At this point, we could technically start the Kubernetes Dashboard, but you'd be presented with the following login screen:
Rather than faff with tokens, we're going to enable a setting that lets you bypass this authentication page entirely.
Obviously don't do this in production!
Disabling the login prompt in Kubernetes Dashboard
The Kubernetes dashboard allows you to bypass the login page if you edit the default deployment and add an extra argument --enable-skip-login.
There's two main ways you can do this:
- Use
kubectl editto open an editor to edit the YAML manifest. - Use
kubectl patchto patch the YAML manifest directly
The former is "easier", while the latter lets you script it (I'll provide the script shortly).
The goal is to update this section of the kubernetes-dashboard deployment (in the kubernetes-dashboard namespace):
spec:
  template:
    spec:
      containers:
      - args:
        - --auto-generate-certificates
        - --namespace=kubernetes-dashboard
        image: kubernetesui/dashboard:v2.2.0
to add the --enable-skip-login argument, as shown here:
spec:
  template:
    spec:
      containers:
      - args:
        - --auto-generate-certificates
        - --namespace=kubernetes-dashboard
        - --enable-skip-login                 # add this argument
        image: kubernetesui/dashboard:v2.2.0
If you want to make this change manually, run the following, which opens notepad.exe
kubectl edit deployment kubernetes-dashboard -n kubernetes-dashboard
make the changes, and close the editor, and Kubernetes will update the deployment.
The above snippet shows the structure of the YAML, but there are a lot more values in the deployment. Make sure you don't accidentally delete any, and take care with the whitespace!
Alternatively (my preference), just run the following command. This does the same thing, adding the extra argument, but avoids having to mess with notepad:
kubectl patch deployment kubernetes-dashboard -n kubernetes-dashboard --type 'json' -p '[{"op": "add", "path": "/spec/template/spec/containers/0/args/-", "value": "--enable-skip-login"}]'
Now we're at a point to give the dashboard a try.
Viewing the Kubernetes Dashboard
To view the dashboard, run kubectl proxy in a terminal:
>  kubectl proxy
Starting to serve on 127.0.0.1:8001
As indicated, you can now call services in the cluster using port 8001. The URL you need for the Kubernetes dashboard is:
http://localhost:8001/api/v1/namespaces/kubernetes-dashboard/services/https:kubernetes-dashboard:/proxy/
Doesn't exactly roll of the tongue, does it? Be sure to bookmark it 🙂
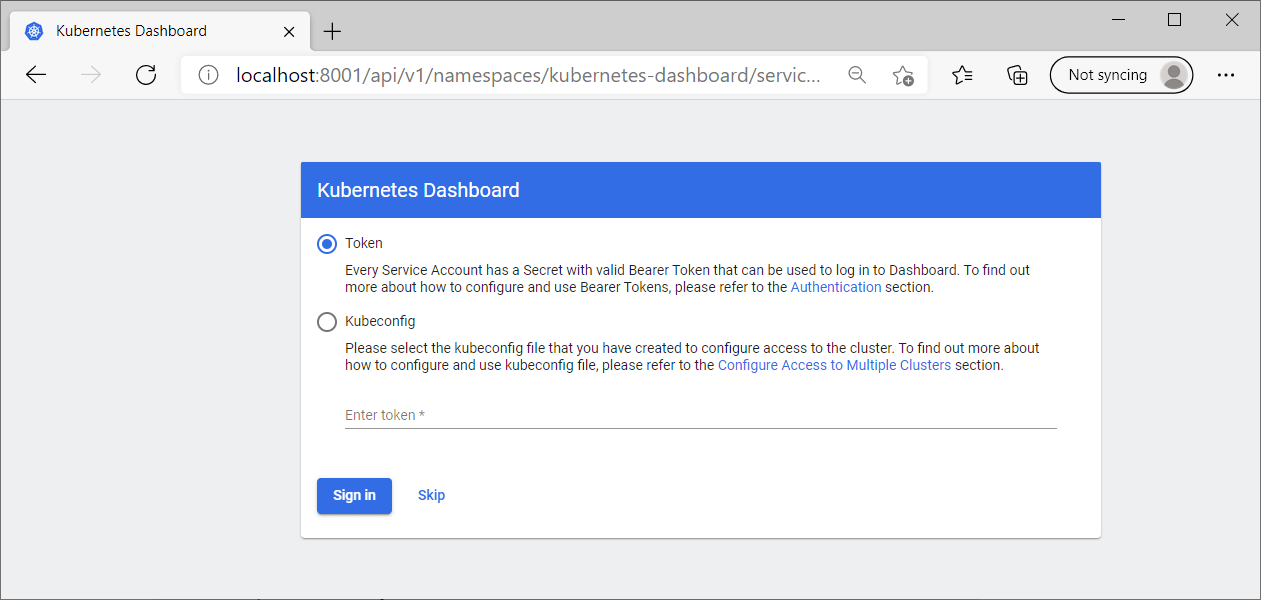
If you now access this page, you'll see the login page as before. But now there's an all-important "skip" button which lets you avoid messing with tokens!
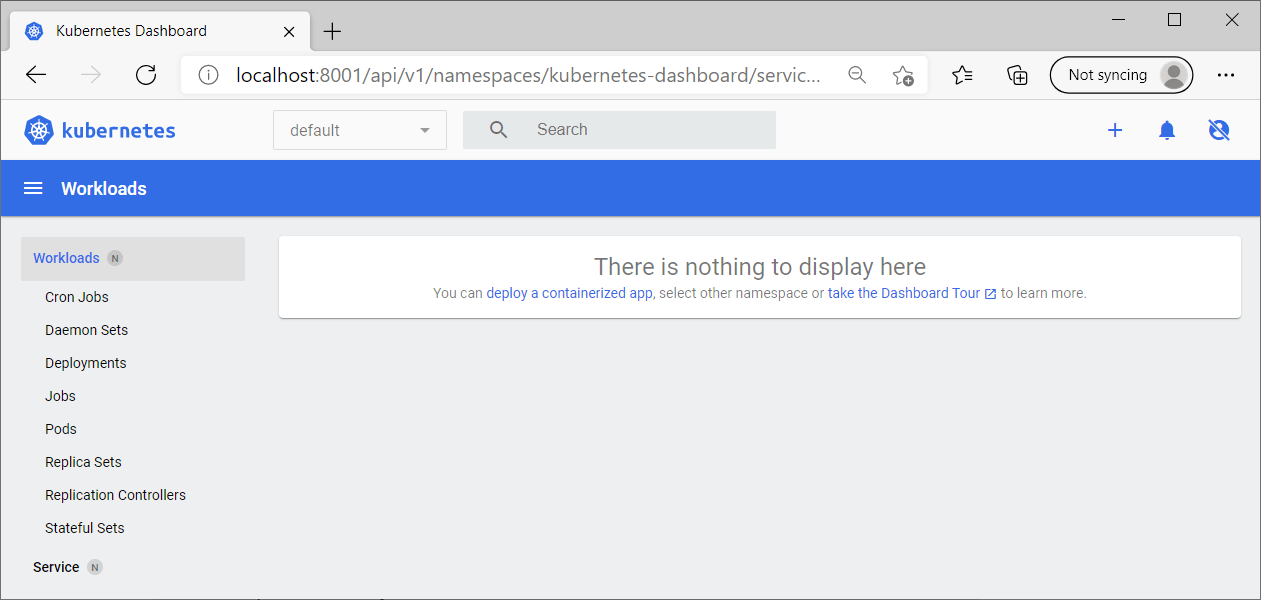
When the dashboard first loads up you're presented with an empty UI—not entirely surprising as you're not running any applications yet!
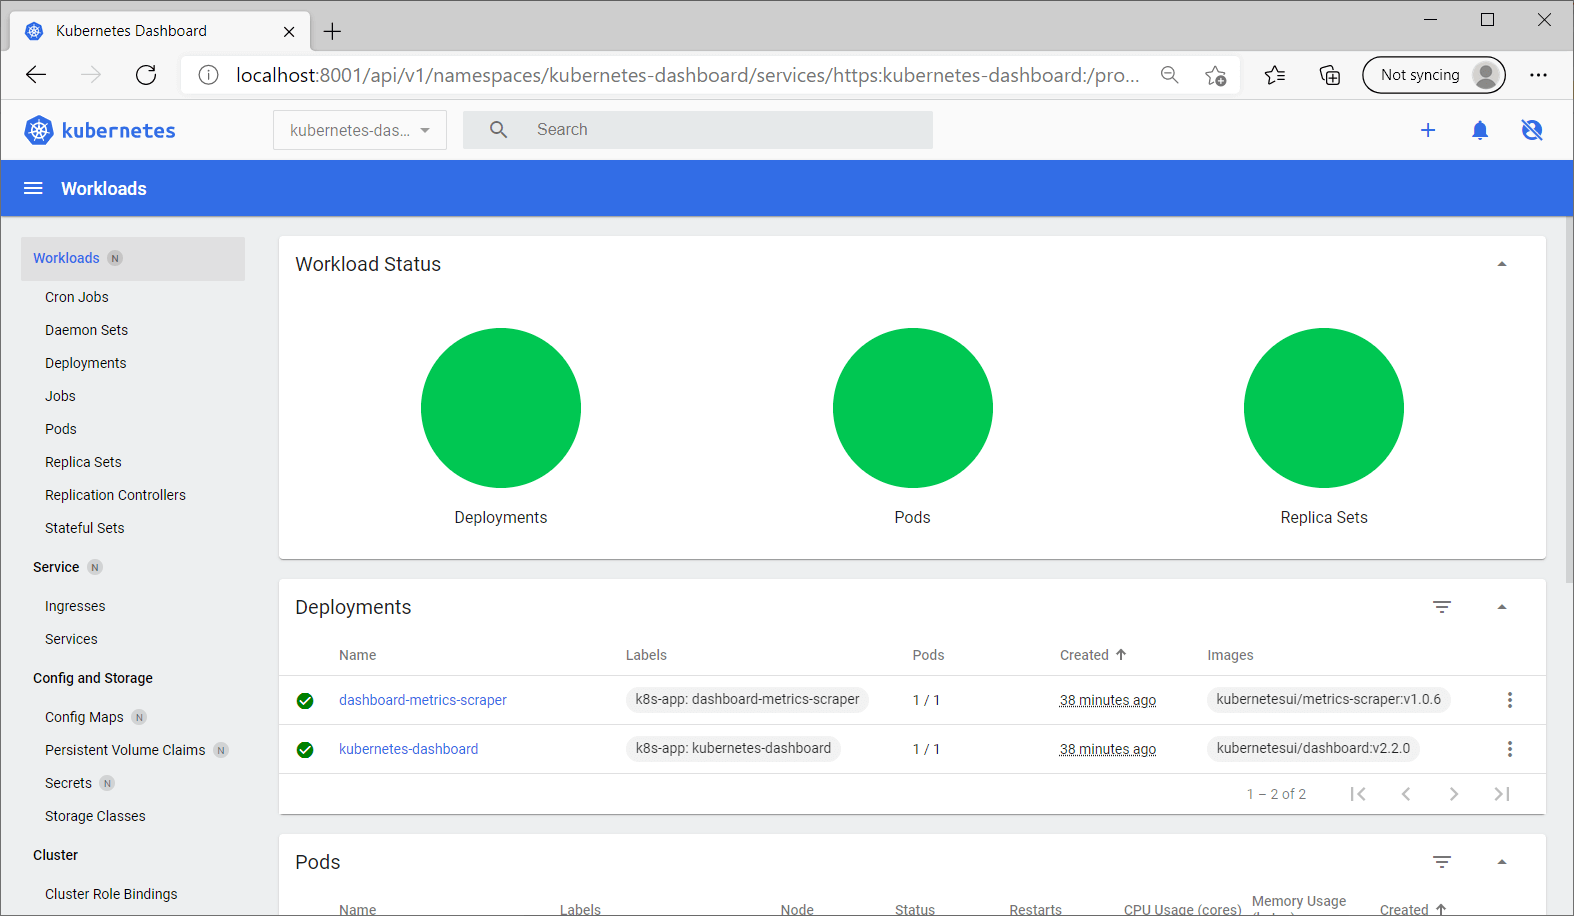
This is the view for the default namespace, which is where your services will be deployed by default. You can view other namespaces by selecting them from the dropdown at the top left of the page. In the following screenshot I've selected the kubernetes-dashboard namespace, so you can see there's two deployments:
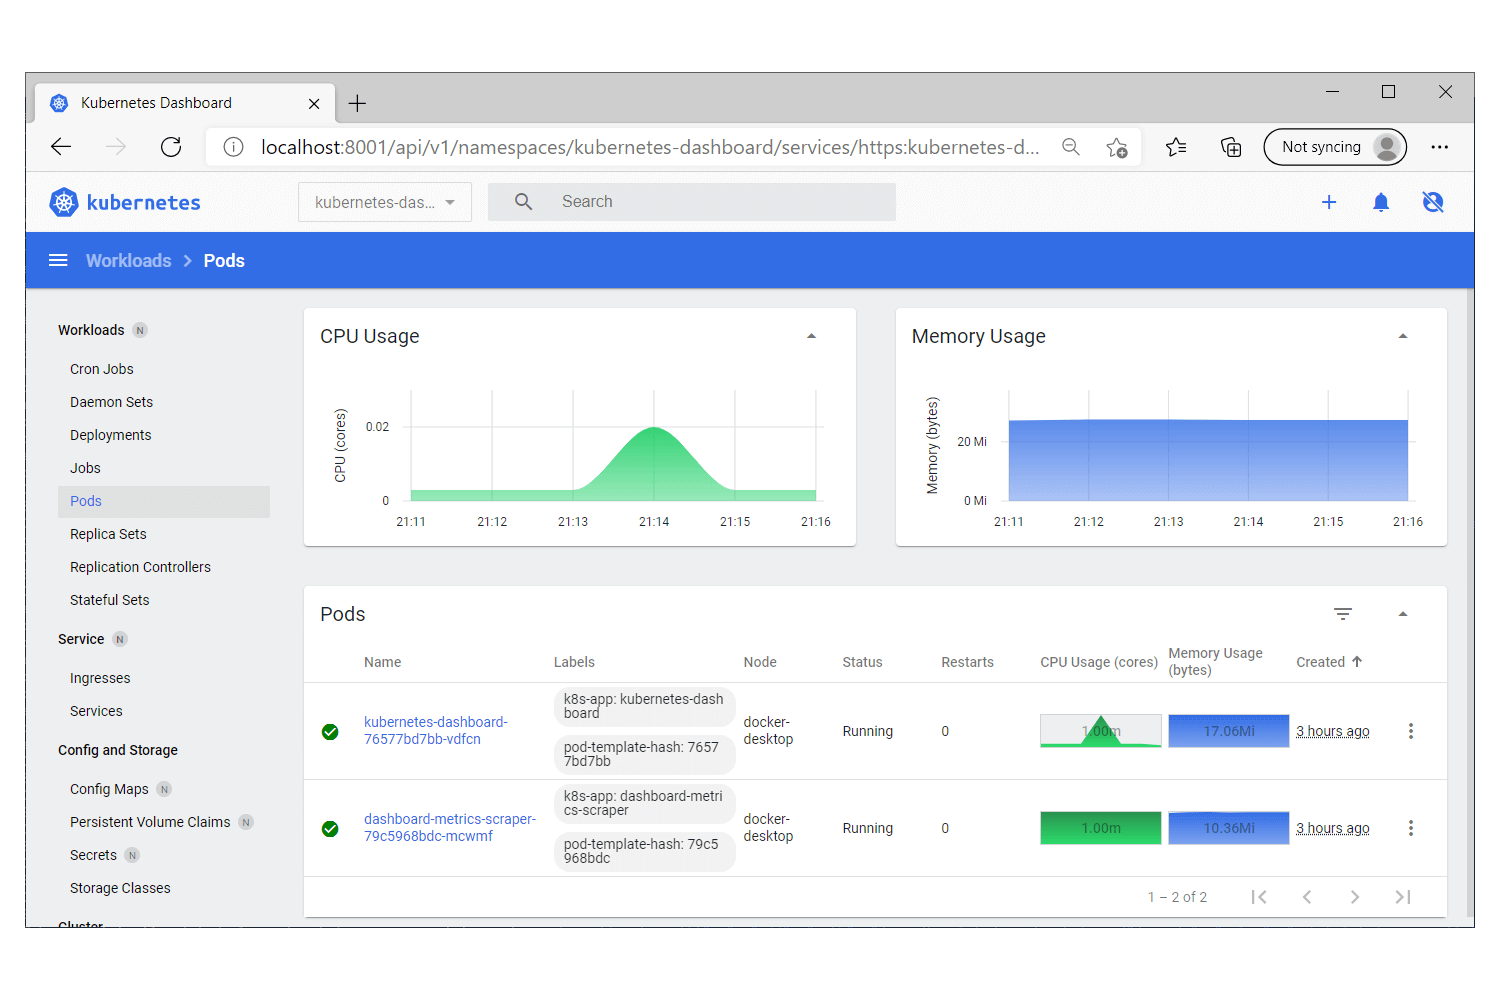
This is all pretty nice, and will be good enough for most people. However, most screenshots of the dashboard show a view that includes nice graphs of CPU and memory usage:
If you want to get these graphs you'll need to install the Kubernetes Metrics Server.
Installing Kubernetes Metrics Server
From the project's GitHub page:
Metrics Server collects resource metrics from Kubelets and exposes them in Kubernetes apiserver through Metrics API…
The Kubernetes Dashboard already comes with the prerequisites for working with metrics server, (did you notice the "metrics-scraper" pod in your cluster?) so you just need to install the Metrics Server itself.
Run the following command to download the Metrics Server manifests and install them in your cluster:
kubectl apply -f https://github.com/kubernetes-sigs/metrics-server/releases/download/v0.4.2/components.yaml
Again, be sure to check you're happy with the script before you download it to to your machine!
This installs a variety of resources in your cluster, but again, we need to patch one of the deployments. We need to add the --kubelet-insecure-tls argument to the metrics-server deployment, otherwise you'll see an error saying something like unable to fetch metrics from node docker-desktop. The following command patches the deployment:
kubectl patch deployment metrics-server -n kube-system --type 'json' -p '[{"op": "add", "path": "/spec/template/spec/containers/0/args/-", "value": "--kubelet-insecure-tls"}]'
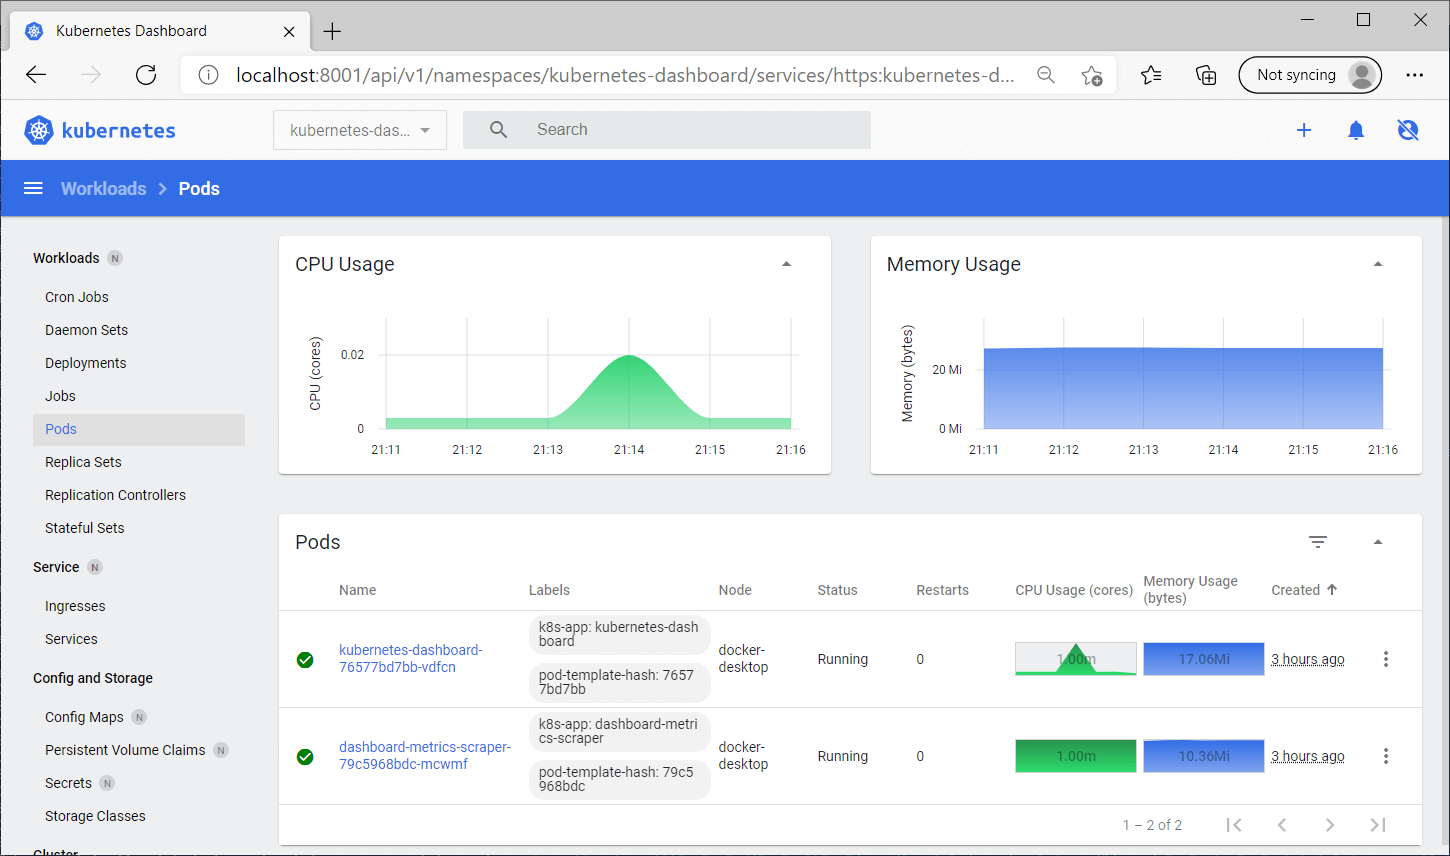
With that, you'll now get nice graphs on your pods! If you're not already, run kubectl proxy and view the pods in the kubernetes-dashboard namespace, we now have nice graphs for everything!
Our dashboard setup is now complete. For completeness, I'll show how to easily delete all the dashboard and metrics resources if you don't need them anymore.
Deleting the dashboard + metrics server
Deleting the resources is very similar to creating them, but instead of using kubectl apply we'll use kubectl delete:
First delete the metrics server:
kubectl delete -f https://github.com/kubernetes-sigs/metrics-server/releases/download/v0.4.2/components.yaml
and then delete the dashboard:
kubectl delete -f https://raw.githubusercontent.com/kubernetes/dashboard/v2.2.0/aio/deploy/recommended.yaml
After that, everything should be back as it was before you started.
Bonus: stopping WSL eating all your memory
While I was playing with the Kubernetes support, I ran into a common issue—WSL was eating all my memory! Luckily, there's an easy fix by creating a .wslconfig file in your user profile folder, as described in the docs.
The following script creates the file, and limits the memory used by WSL to 8GB
New-Item "$env:USERPROFILE\.wslconfig" -ItemType File -Value "[wsl2]
memory=8GB # Limits VM memory in WSL 2 to 8 GB"
That solved the issue I was seeing.
Summary
In this post I showed how to enable Kubernetes for Docker Desktop, how to install the Kubernetes Dashboard, and how to install Metrics Server to provide CPU and memory usage graphs in the dashboard. The following script installs and patches both the dashboard and metrics server, and then starts the kubectl proxy so you can access the dashboard:
# Install Kubernetes Dashboard
kubectl apply -f https://raw.githubusercontent.com/kubernetes/dashboard/v2.2.0/aio/deploy/recommended.yaml

# Patch the dashboard to allow skipping login
kubectl patch deployment kubernetes-dashboard -n kubernetes-dashboard --type 'json' -p '[{"op": "add", "path": "/spec/template/spec/containers/0/args/-", "value": "--enable-skip-login"}]'

# Install Metrics Server
kubectl apply -f https://github.com/kubernetes-sigs/metrics-server/releases/download/v0.4.2/components.yaml

# Patch the metrisc server to work with insecure TLS
kubectl patch deployment metrics-server -n kube-system --type 'json' -p '[{"op": "add", "path": "/spec/template/spec/containers/0/args/-", "value": "--kubelet-insecure-tls"}]'

# Run the Kubectl proxy to allow accessing the dashboard
kubectl proxy
After you start the proxy, you can access the dashboard at the following link: http://localhost:8001/api/v1/namespaces/kubernetes-dashboard/services/https:kubernetes-dashboard:/proxy/.