Raygun are well known in the error/crash reporting space, especially for .NET applications. They also have a relatively new application performance monitoring (APM) product for measuring server-side performance. In June 2019, Raygun added support for .NET Core to Raygun APM, allowing you to monitor your .NET Core applications in production. In this post I take a first look at Raygun APM, show how to configure the Raygun agent for profiling, and explore the Raygun APM web interface.
This is a sponsored post - Raygun contacted me and asked if I'd be interested in reviewing their new APM, and provided access for me to test it out. That said, everything in the post is my own impressions and opinions.
Introduction: what's an APM and why would I want one?
If you've never used an application performance monitoring tool, you may be thinking "what is it, and why do I care?". The term APM is pretty general, and could range from basic metric collection and network request timings, to deep code inspection where you can see individual method analytics.
Raygun Application Performance Monitoring (APM) falls in the latter group of tools, much like Stackify Retrace or New Relic. These tools are designed to tell you which requests to your application are taking a long time to execute, but also why they were slow. This latter point is one of the key features of APMs. You can tell how long a request takes just by looking at flat log files, but an APM can easily show you exactly which part of your app was causing the problem.
Another point is that APMs are often running continuously in production, in contrast to the manual approach of attaching a profiler ad hoc to debug an issue. To avoid performance problems, they typically use sampling, so only a subset of requests have detailed traces reecorded, though this is normally configurable.
Personally I don't have a huge amount of experience with APM projects. Some of the apps I've written have used an APM, but I've not often been involved in tracking down performance issues. But on the occasions where I have, an APM was invaluable for giving real-world numbers and an indication of where the problem lies. Debugging locally is one thing, but the issues you see in production when multiple users are calling your app can be fundamentally different to what you see (or can reproduce) on a single developer's machine!
For that reason, the best place for trying out an APM is in production. Currently Raygun APM supports .NET Core, but is Windows only (Linux support is coming soon). That is a bit of an issue for me as although I develop on Windows, all my .NET Core workloads in production are running in Docker on Linux!
Consequently, this post looks at the install process for the Raygun APM agent on Windows, and takes an initial look at the tool itself. Once Linux support is released I'll revisit the APM in production, and really dig into the features.
Getting started: sign up and installing the Raygun Agent
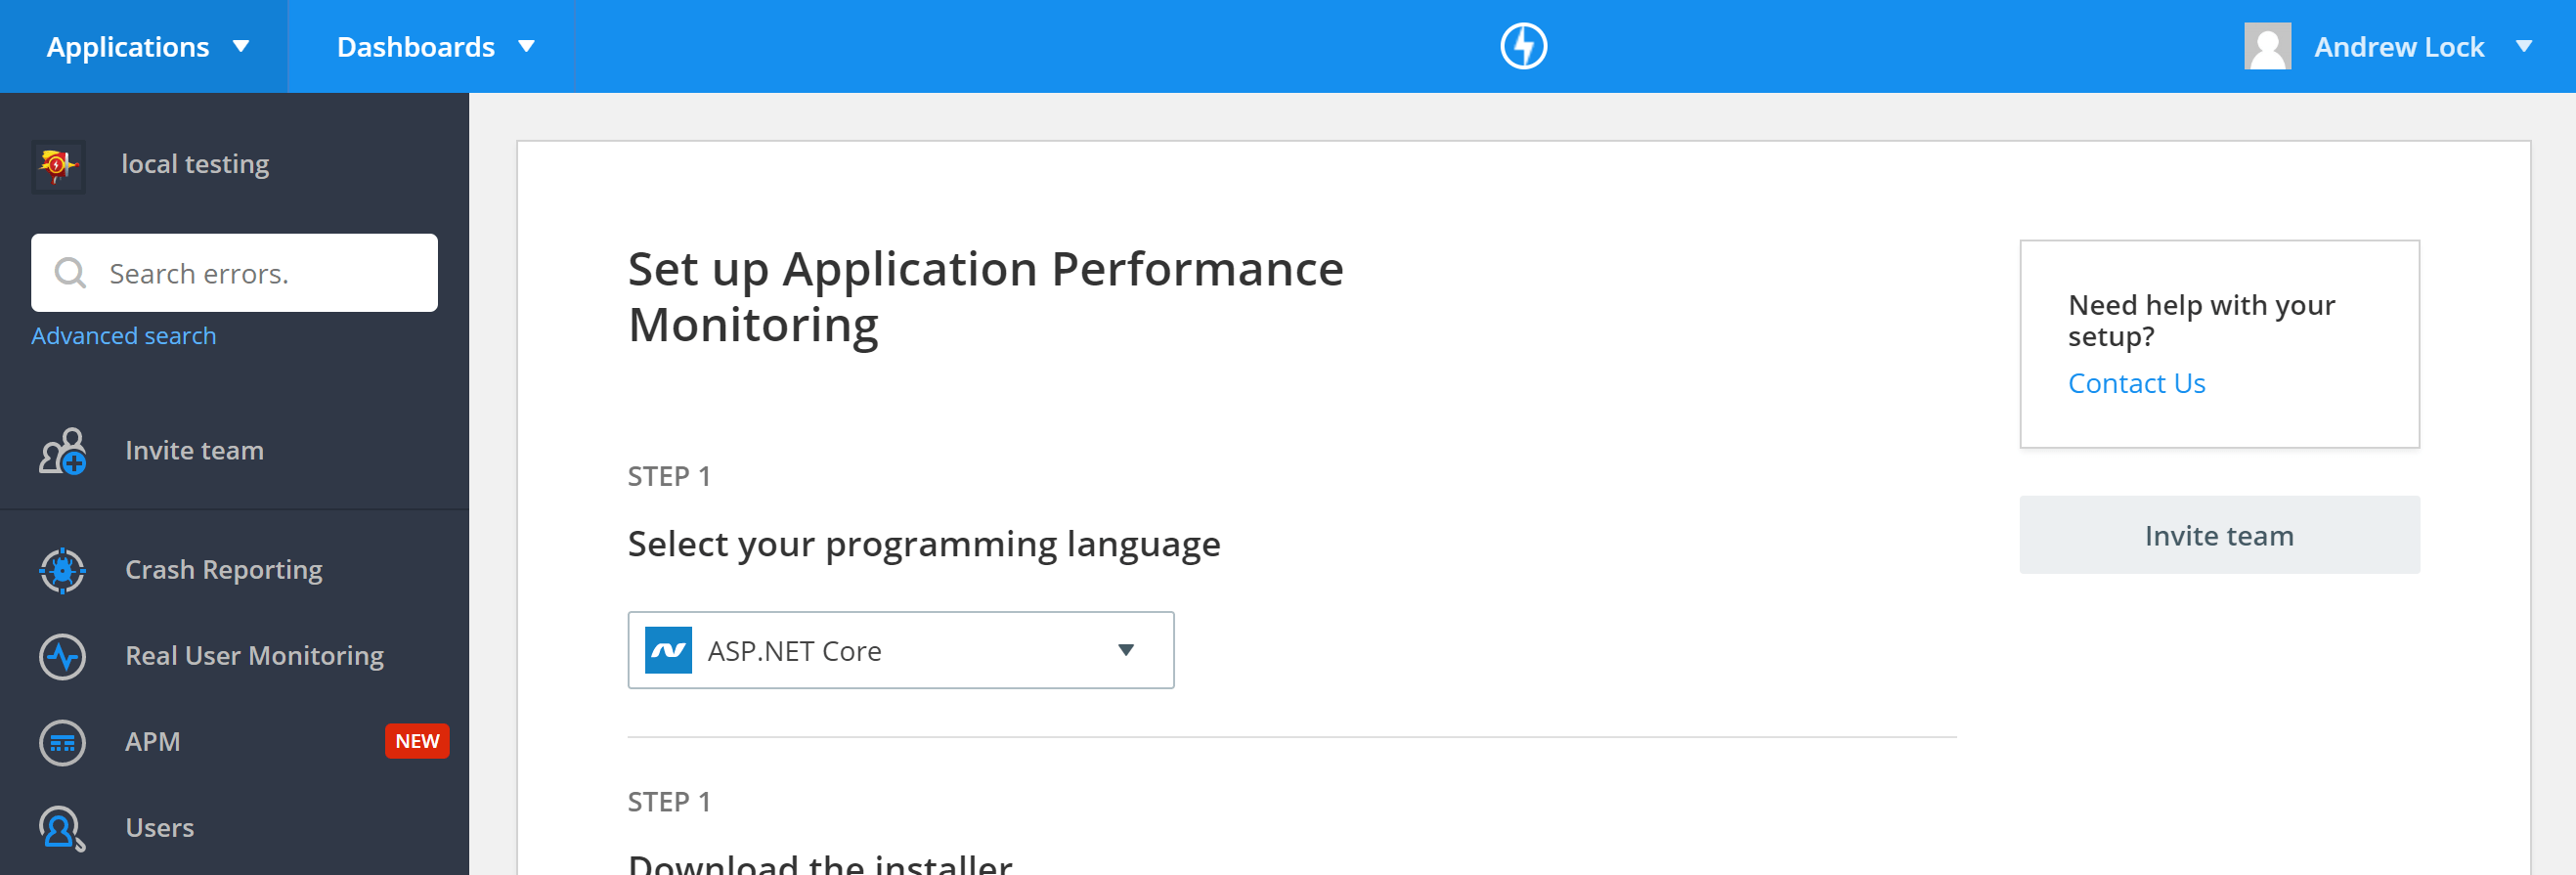
To use Raygun APM you'll need a Raygun account. If you don't have one already, you can signup for a 14 day free trial. If you're already using Raygun's crash reporting or real user monitoring services then sign-in to the Raygun dashboard and click "APM" from the side menu. After accepting the free-trial, you're provided with instructions for installing the Raygun agent:
Installing the agent was simple - head to the download page, and download the latest version. It's a 10MB .msi installer that only has a few steps and nothing really to configure at this stage:
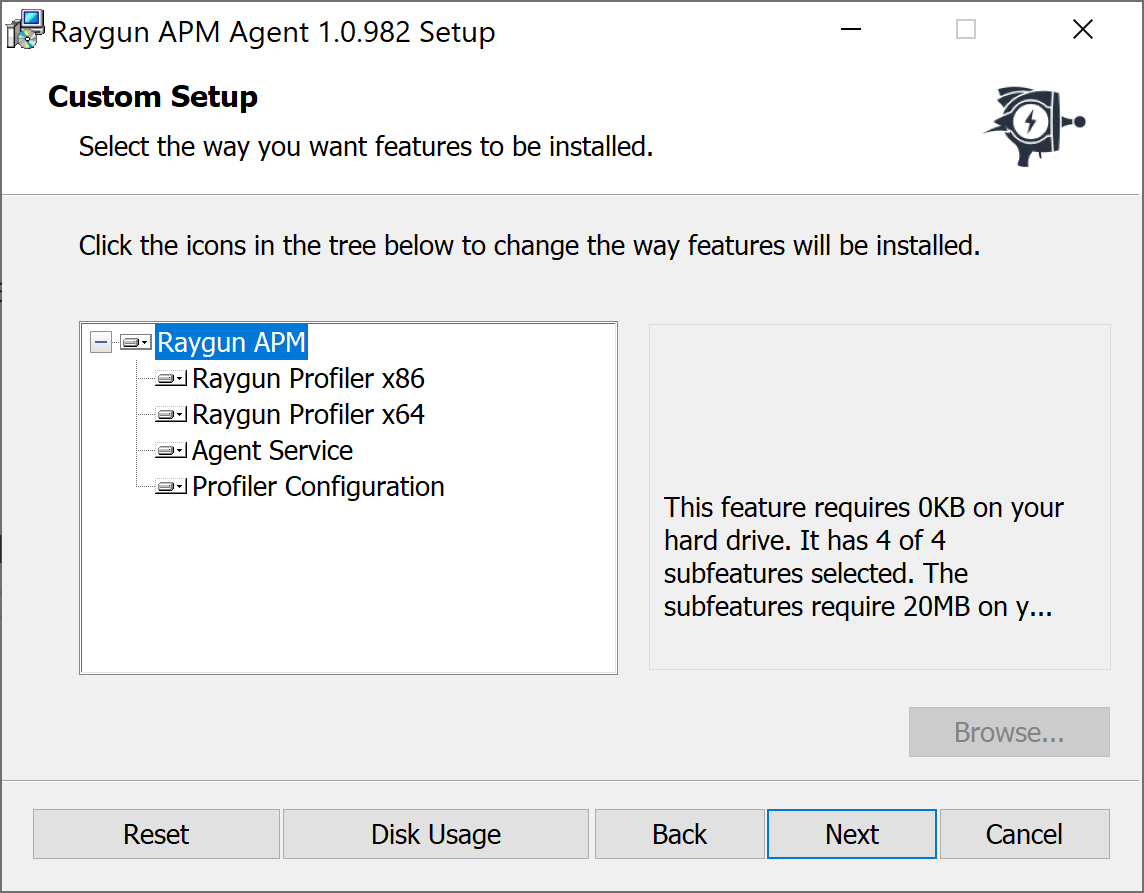
The installer adds four separate components:
- The Raygun profilers (32 and 64 bit). This is the profiler that attaches to your .NET Core app.
- The agent service. This is the Windows service that connects to the Raygun API. It acts as an intermediary between the profiler and the API.
- The profiler configuration tool. This tool allows you to configure the agent and profiler (to set your API keys) as well as to connect applications to the profiler.
When the installer completes, you're prompted to run the "Raygun profiler configuration tool" to register the newly installed agent service with the Raygun API. You'll need the API key for your Raygun application (which is displayed in the APM section of your Raygun dashboard).
Note that you only need the API key for a single application from your account at this stage. You can still monitor multiple applications (with different API keys) - you just need to pick one at this stage to register the agent.
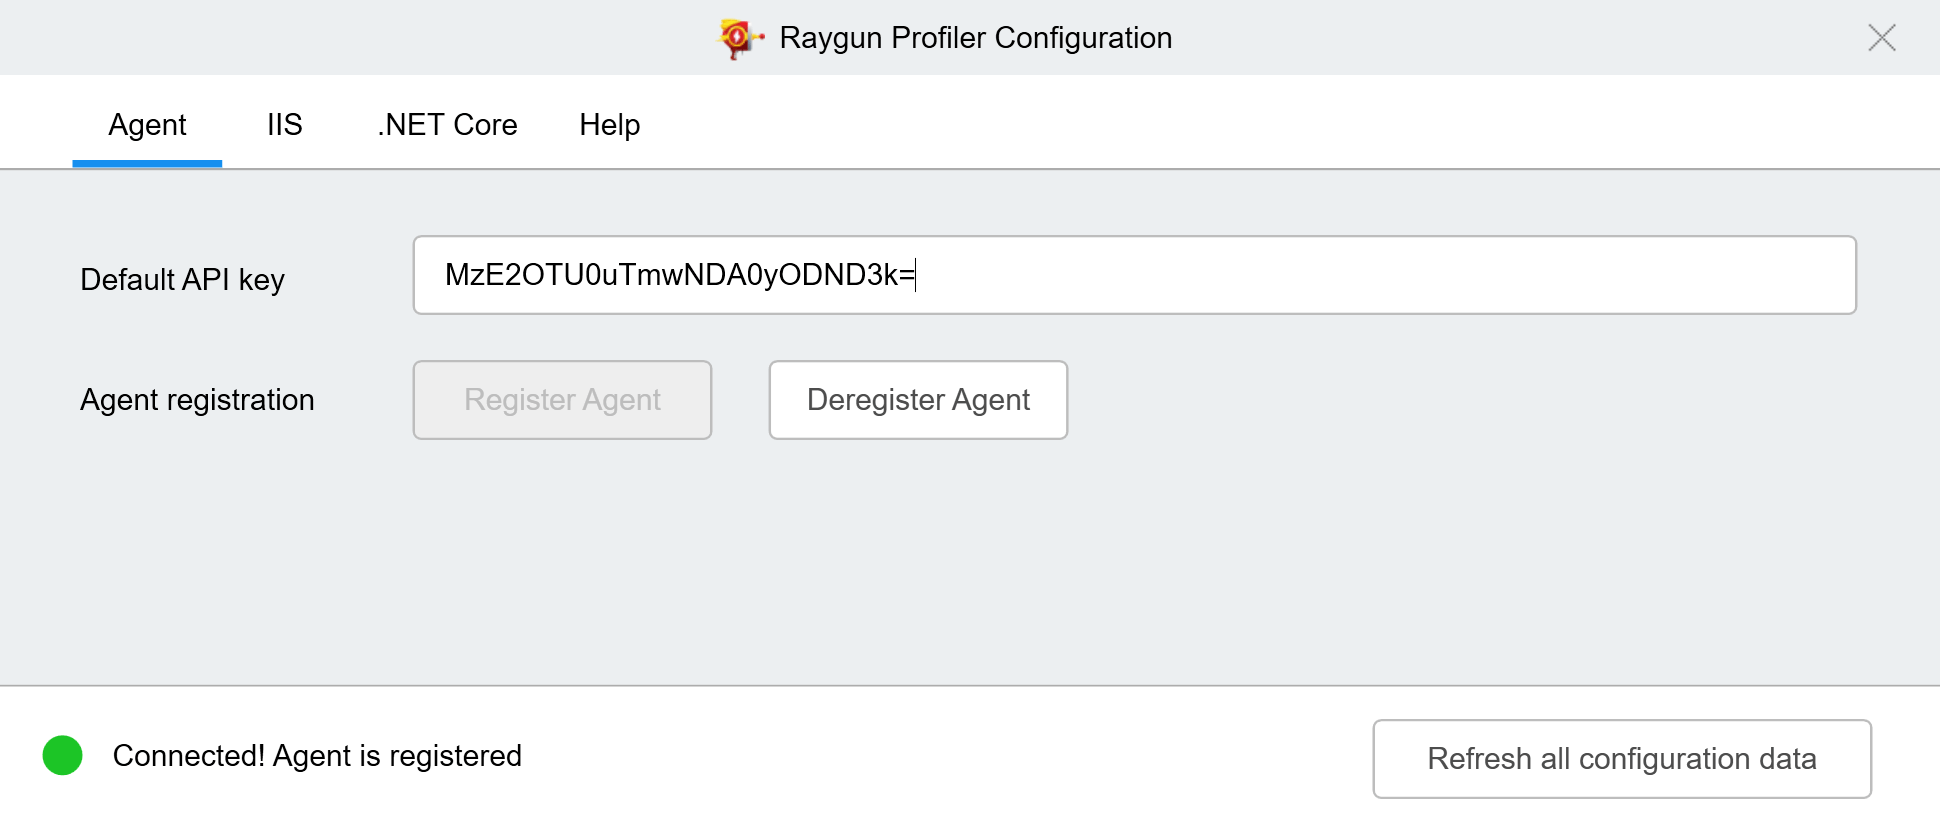
After registering the agent (and getting the confirmation green light) you're all set to start profiling your first .NET Core application.
Preparing an application for profiling
In general, you don't need to do anything special to use Raygun's APM with your application. There's no NuGet to install or code changes to make; the hooks are all within the .NET runtime itself!
That said, if you're using Raygun APM, it probably makes sense to use their crash reporting tool as well (so you can correlate events between the services). If you do it's recommended that you update to the latest Raygun4Net package (either for .NET Core or for ASP.NET Core).
To prepare your application for the APM, you'll want to make sure to publish it locally in release mode first, rather than trying to run it using dotnet run. Given that most people will likely only use the APM in production that's probably a given, but I'm only testing it locally for now, so I published my app using:
dotnet publish -c Release
Once your application is published you can register it with the agent using the profiler configuration tool. Click on the ".NET Core" tab and you have two options:
- Run your app in the background using
dotnet MyApp.Api.dll, and then select it from the drop-down box - Browse to your app's dll
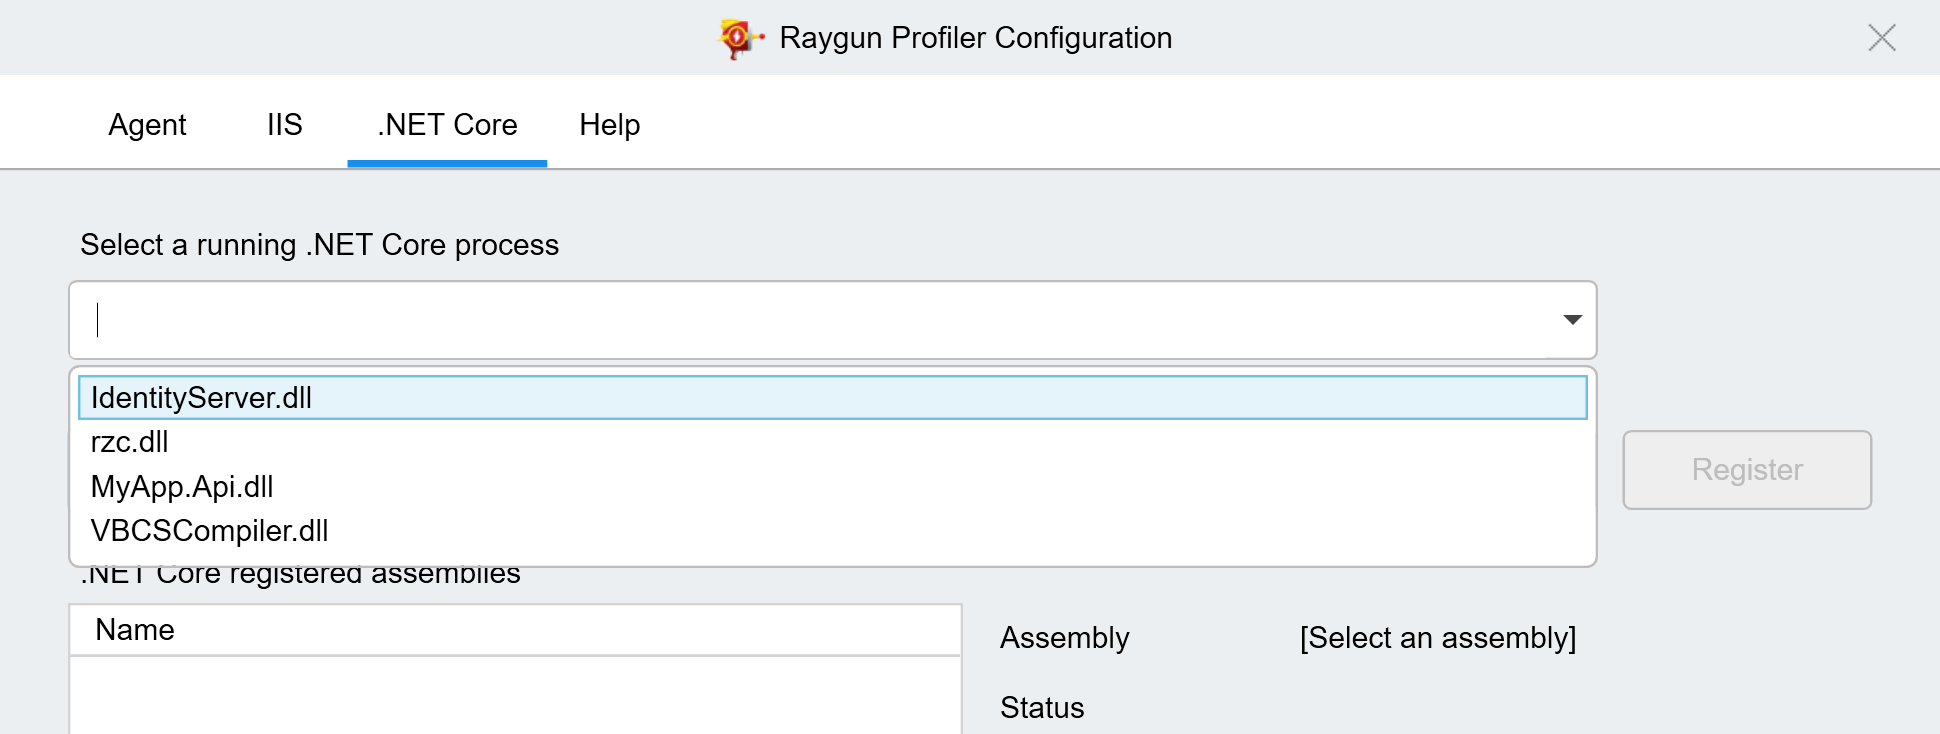
Whichever approach you choose, click "Register". You then need to enter the API key for the application, and set the "Startup period" for the app. This API key can be different to the one you used for registering the agent, and controls where the APM traces will end up. The startup period (presumably) delays profiling for the application to ensure that your app's startup times aren't hindered.
Once the app is registered, the configuration tool shows a popup with instructions on how to enable the profiler for your application. The instructions boil-down to "set a bunch of environment variables" but it's nice they have the exact commands laid out (for PowerShell, Command prompt, or IIS web.config). The example commands below are for PowerShell, including the dotnet command to run the app at the end:
$Env:CORECLR_ENABLE_PROFILING = "1"
$Env:CORECLR_PROFILER = "{e2338988-38cc-48cd-a6b6-b441c31f34f1}"
$Env:CORECLR_PROFILER_PATH_32 = "C:\Program Files (x86)\Raygun\RaygunProfiler\1.0.982\x86\RaygunProfiler.dll"
$Env:CORECLR_PROFILER_PATH_64 = "C:\Program Files\Raygun\RaygunProfiler\1.0.982\x64\RaygunProfiler.dll"
$Env:COMPLUS_ProfAPI_ProfilerCompatibilitySetting = "EnableV2Profiler"
$Env:PROTON_STARTUP_PERIOD = "60"

dotnet.exe MyApp.Api.dll
Tip: if you want to see these commands for your own machine later, select a registered application from the profiler configuration tool, and click "Show Config".
If GUI tools aren't your thing, then you can always use the Raygun CLI tool to register the agent and configure your applications. This tool also includes a variety of diagnostic helpers if you run into issues getting the profiler working.
If you've followed this far, you should now have an application sending traces to Raygun APM! I browsed around my app a little to generate some traffic, and explored the results in the dashboard.
Exploring the results on Raygun
As I mentioned previously, I could only test the Raygun APM locally for now, so the screenshots and overview in this section won't necessarily be very similar to a production workload. I was able to get a feel for what's possible, even with this small app, but I'm looking forward to trying it with something more substantial!
The APM Dashboard
The APM dashboard leads with a variety of graphs for showing your apdex, request duration, your requests per minute (RPM), and a breakdown of where the time was spent in the request (external API calls/methods/database queries).
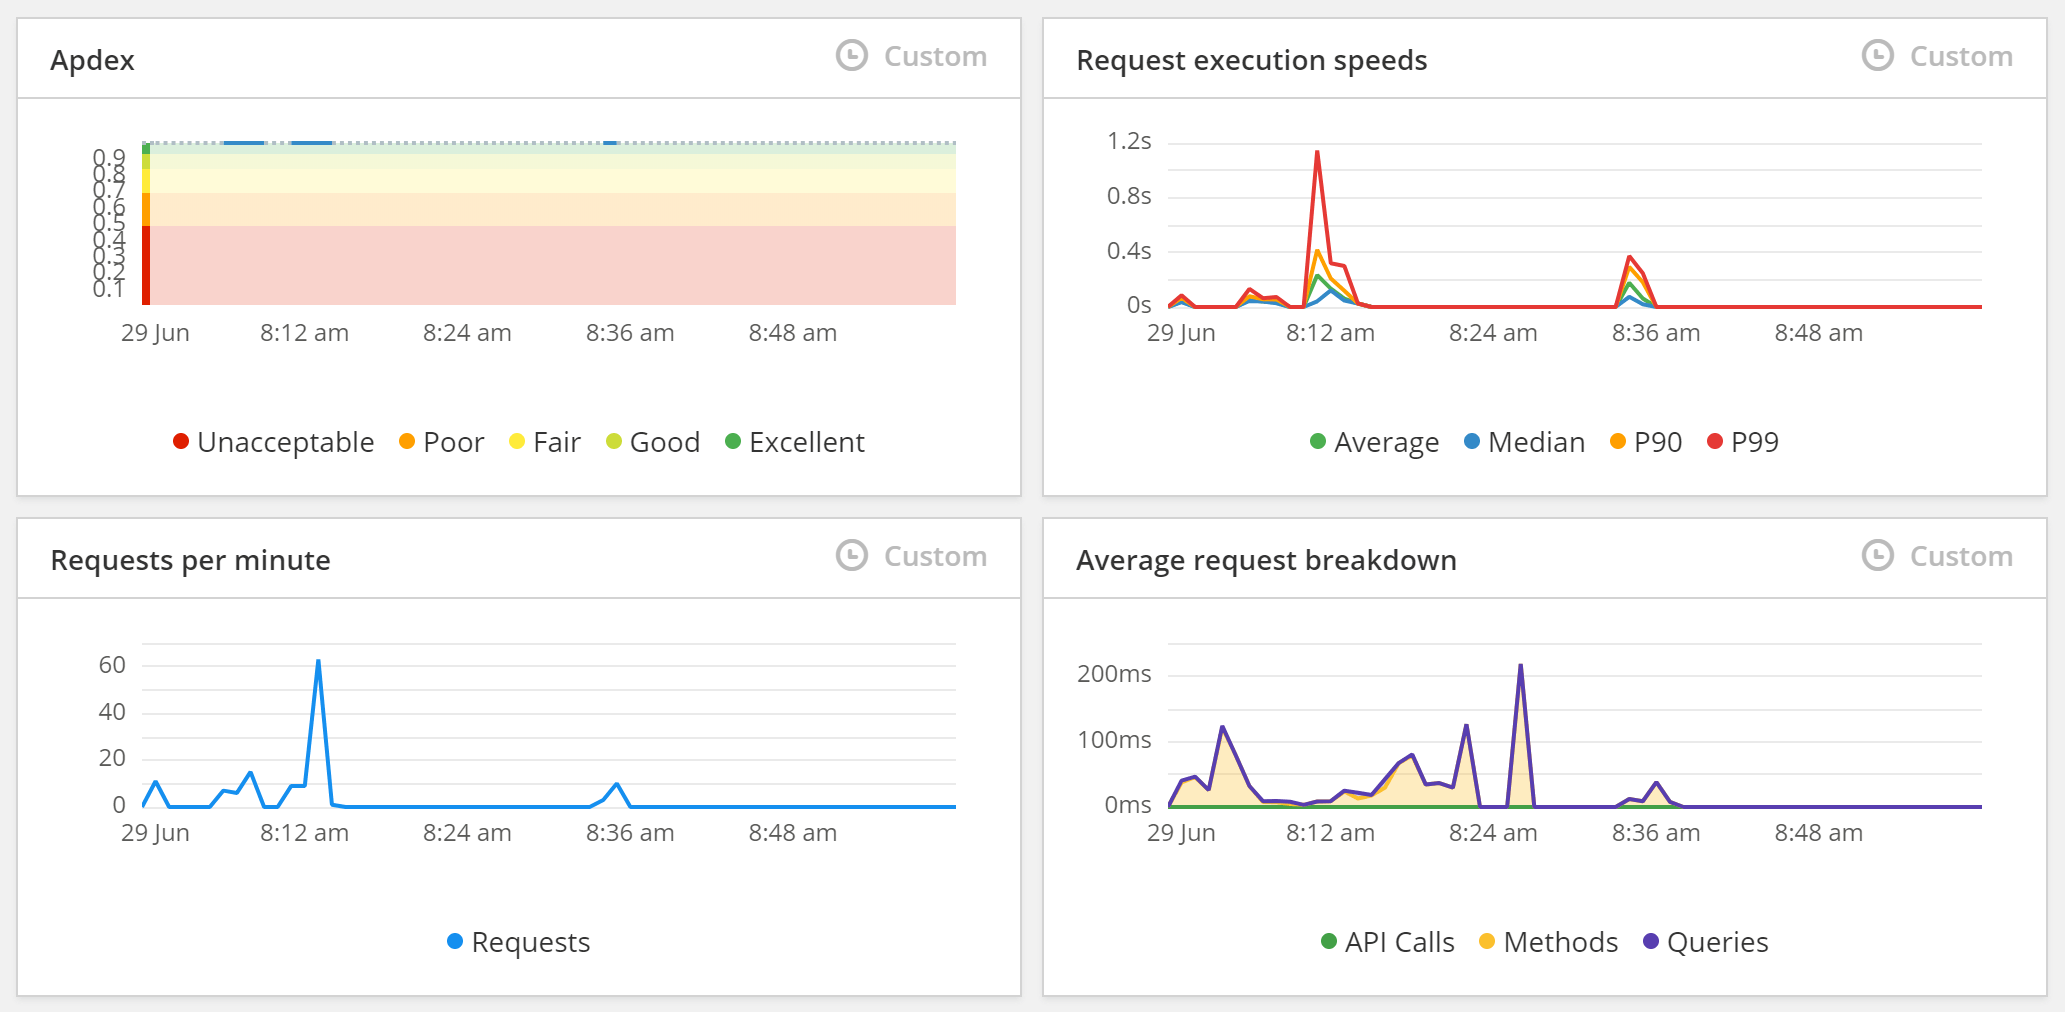
I especially like that this doesn't just show the average request speed, but includes the 90th and 99th percentile view too. Those occasional slow requests typically have a bigger impact on users perception of your app's performance than the average. I suspect the average request breakdown will also be useful for spotting times when your database queries are causing delays.
Below the trend graphs, you'll find some counters, and then scrolling lists of the slowest requests, traces, methods, external API calls, and database queries.
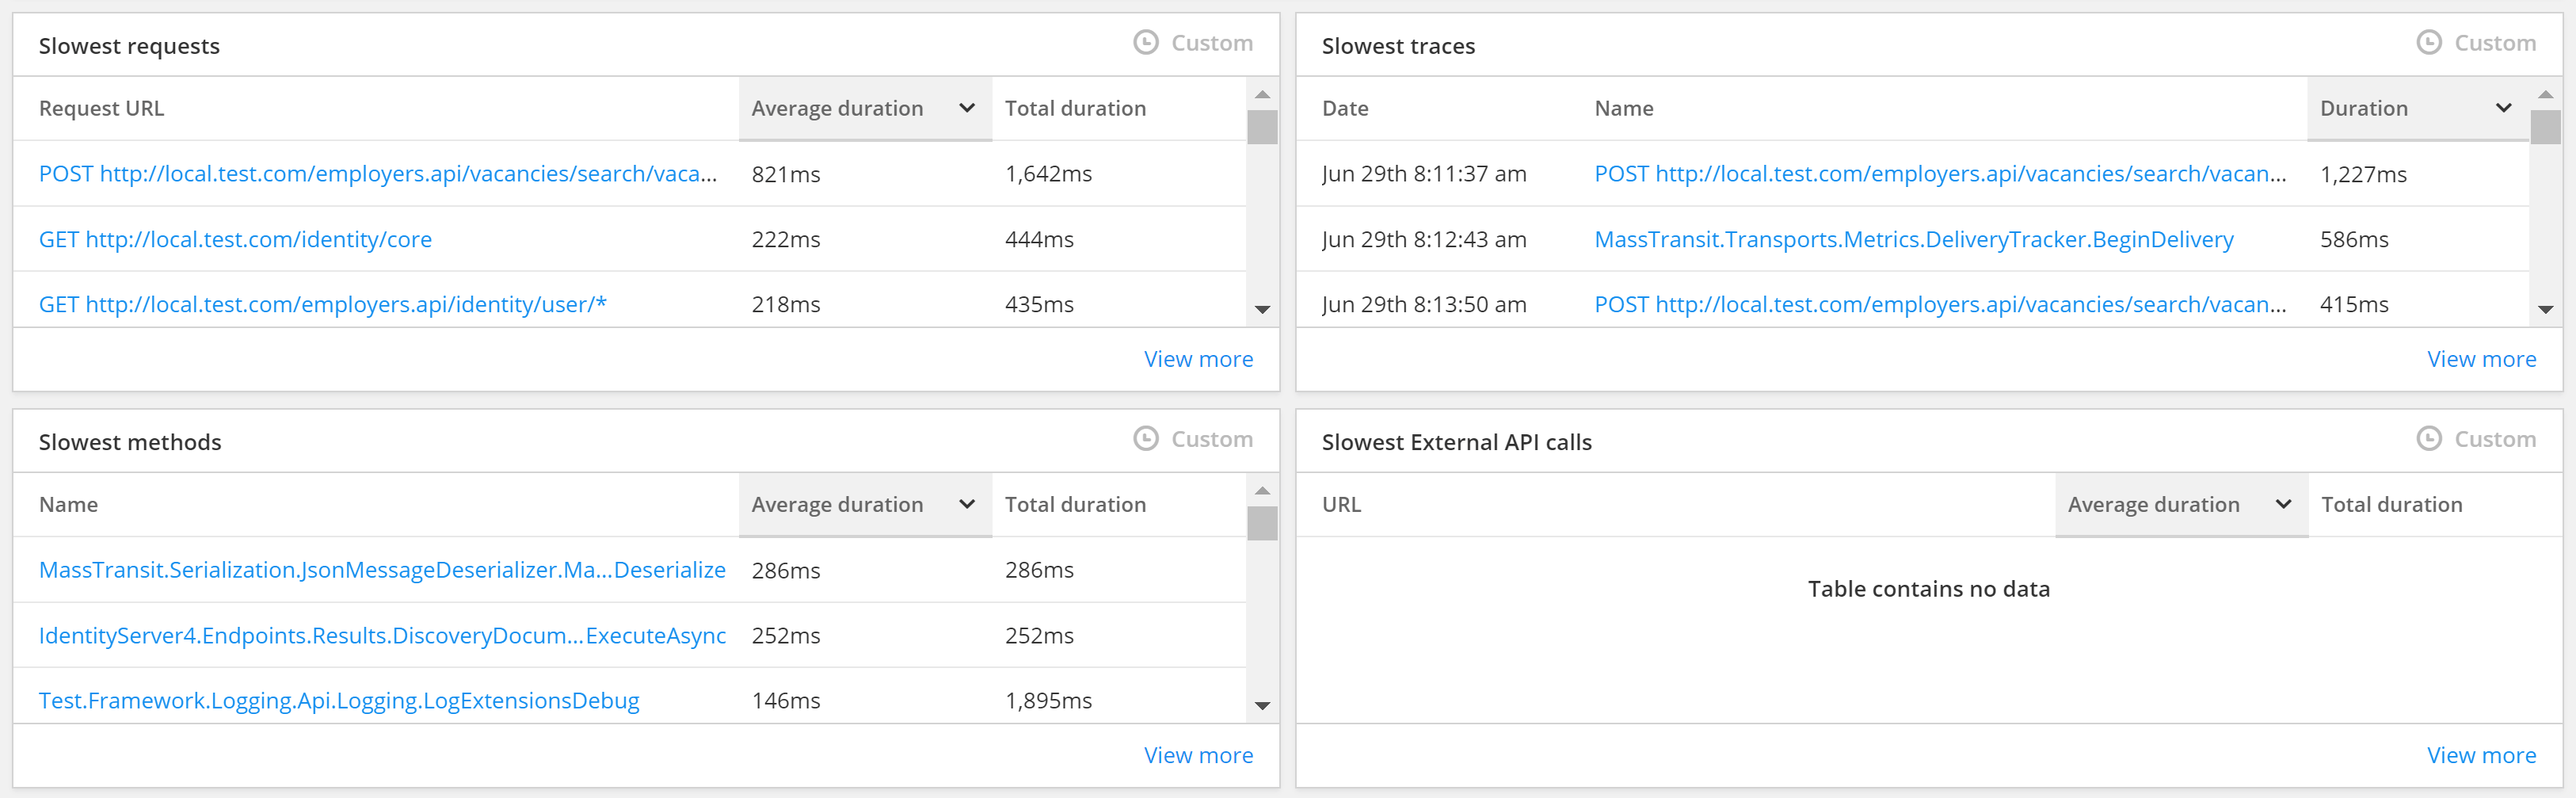
Each of these links is clickable, and lets you explore the request/trace/method further. This is the key feature of an APM, allowing you to dig in and figure out why it was slow. I choose a slow trace and clicked on it to take me to the trace detail page.
Exploring a trace
A trace is a request that has been profiled in detail. You can control how often the profiler should record traces from the Sampling menu in the Raygun dashaboard. As I was only testing locally, I chose to accept 100% of traces, but you would definitely want to pare that down in production. Luckily you can set rules on a per-URL basis, so you could set a low overall sample rate but increase the capture rate for problematic URLs for example.
When viewing a trace, you get a really nice overview for exploring what's going on:
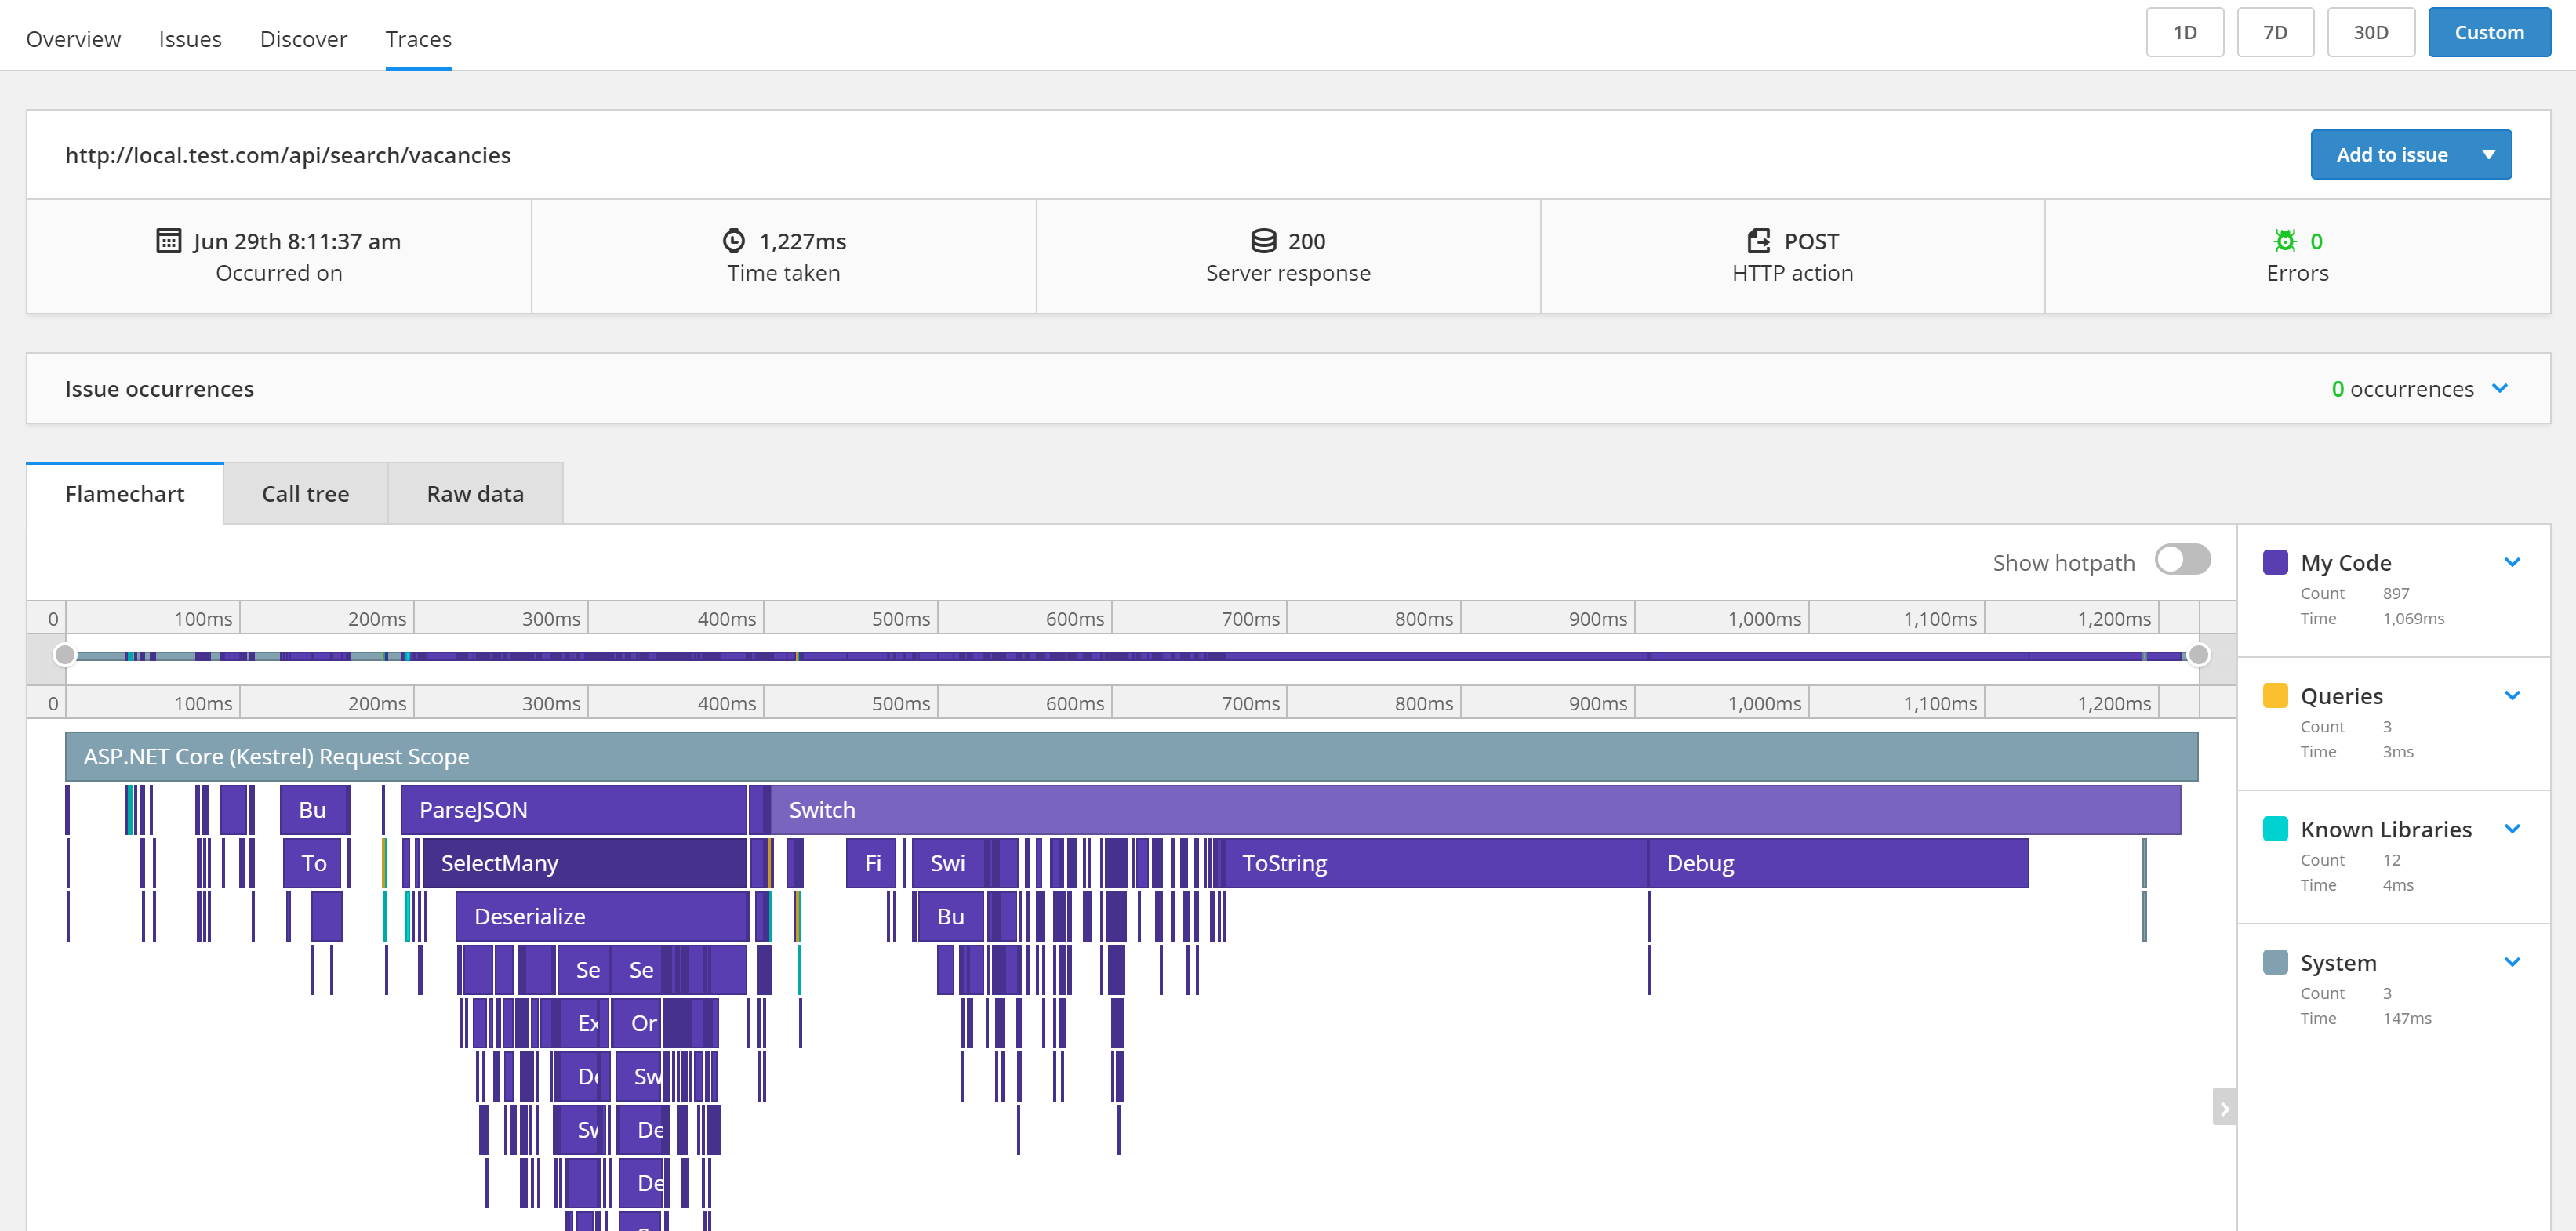
At the top of the page you can see a summary of the request (the URL, timings, status code) but the really interesting point is the flame chart below it. A flame chart shows all the method that were called for a given trace, along with how long each one took - the wider the bar, the longer the method executed for.
At the top of the chart you can see ASP.NET Core (Kestrel) Request Scope which lasts the whole trace (as the trace is for a single request). Within this request you can see there were lots of short method calls, but also some that took a very long time. Two obvious ones that stand out to me are ToString and Debug at the right of the image, which together take up nearly 500ms of time. From this simple view it's easy to pick out troublemakers like this.
A nice part of this is that Raygun explicitly breaks out methods that involve database (e.g. Redis) lookups and external API calls. Interestingly, Raygun didn't seem to be breaking out my database calls (which use Dapper and NpgSql) or elastic search client calls. I'm informed that NpgSQL, SQLServer, MySQL, ES, and Redis should all be detected as database calls though, so I'm in touch with them figuring out why
Raygun APM also includes GitHub integrations (among others) so you can click on methods in the flame chart and get a preview of the code inline! I'm looking forward to trying that out later.
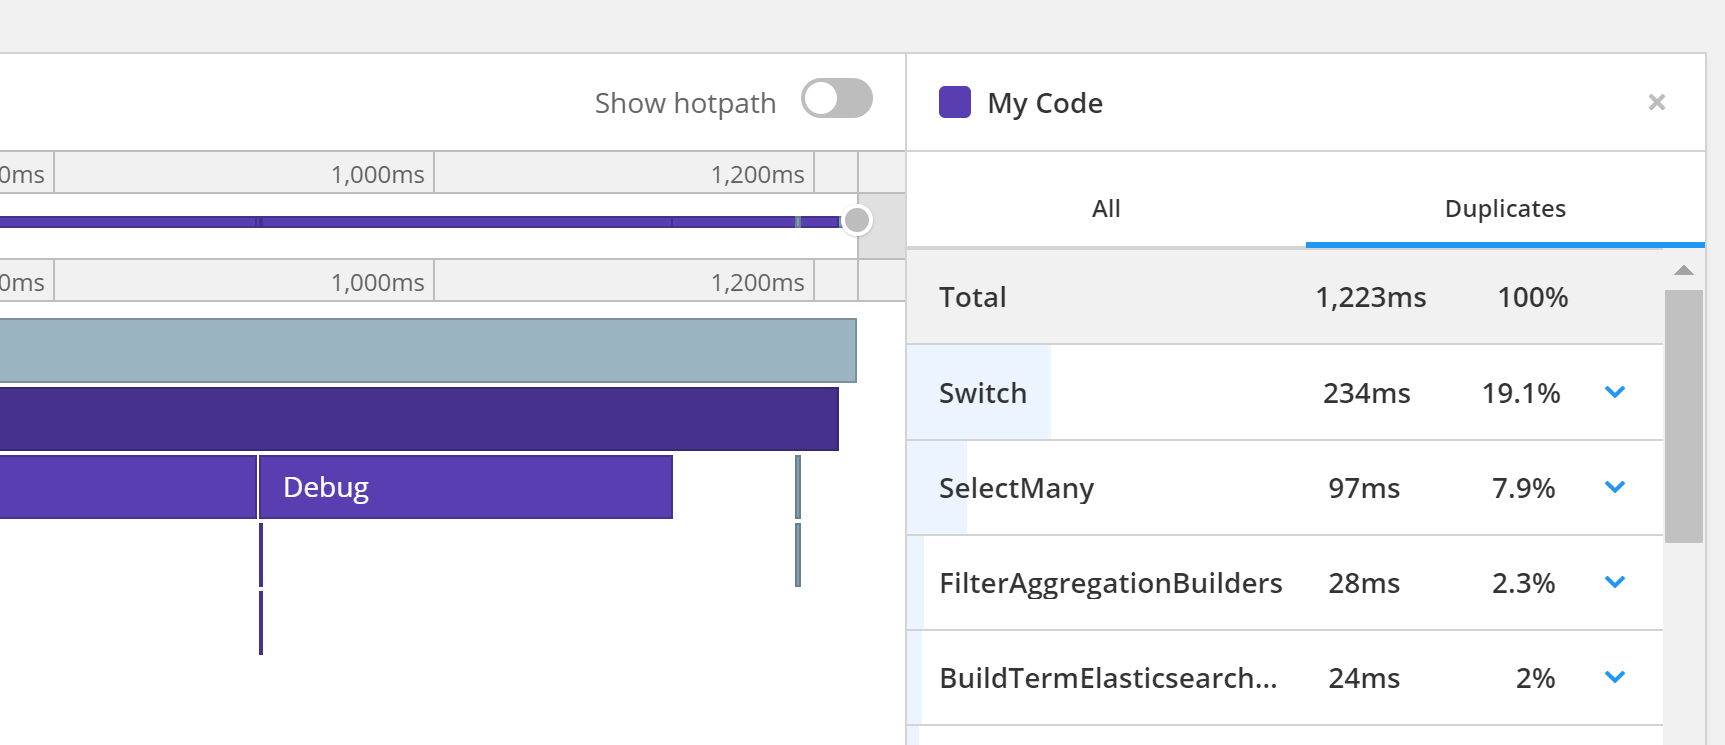
It's easy to spot the obviously slow methods like this, but you also need to look out for those methods that don't take a long time to execute individually, but are called so many times that the delay adds up. On the right hand-side of the flame chart you can see lists of the methods called in the trace. This lets you group them so you can see the total duration of all invocations of a method within the trace:
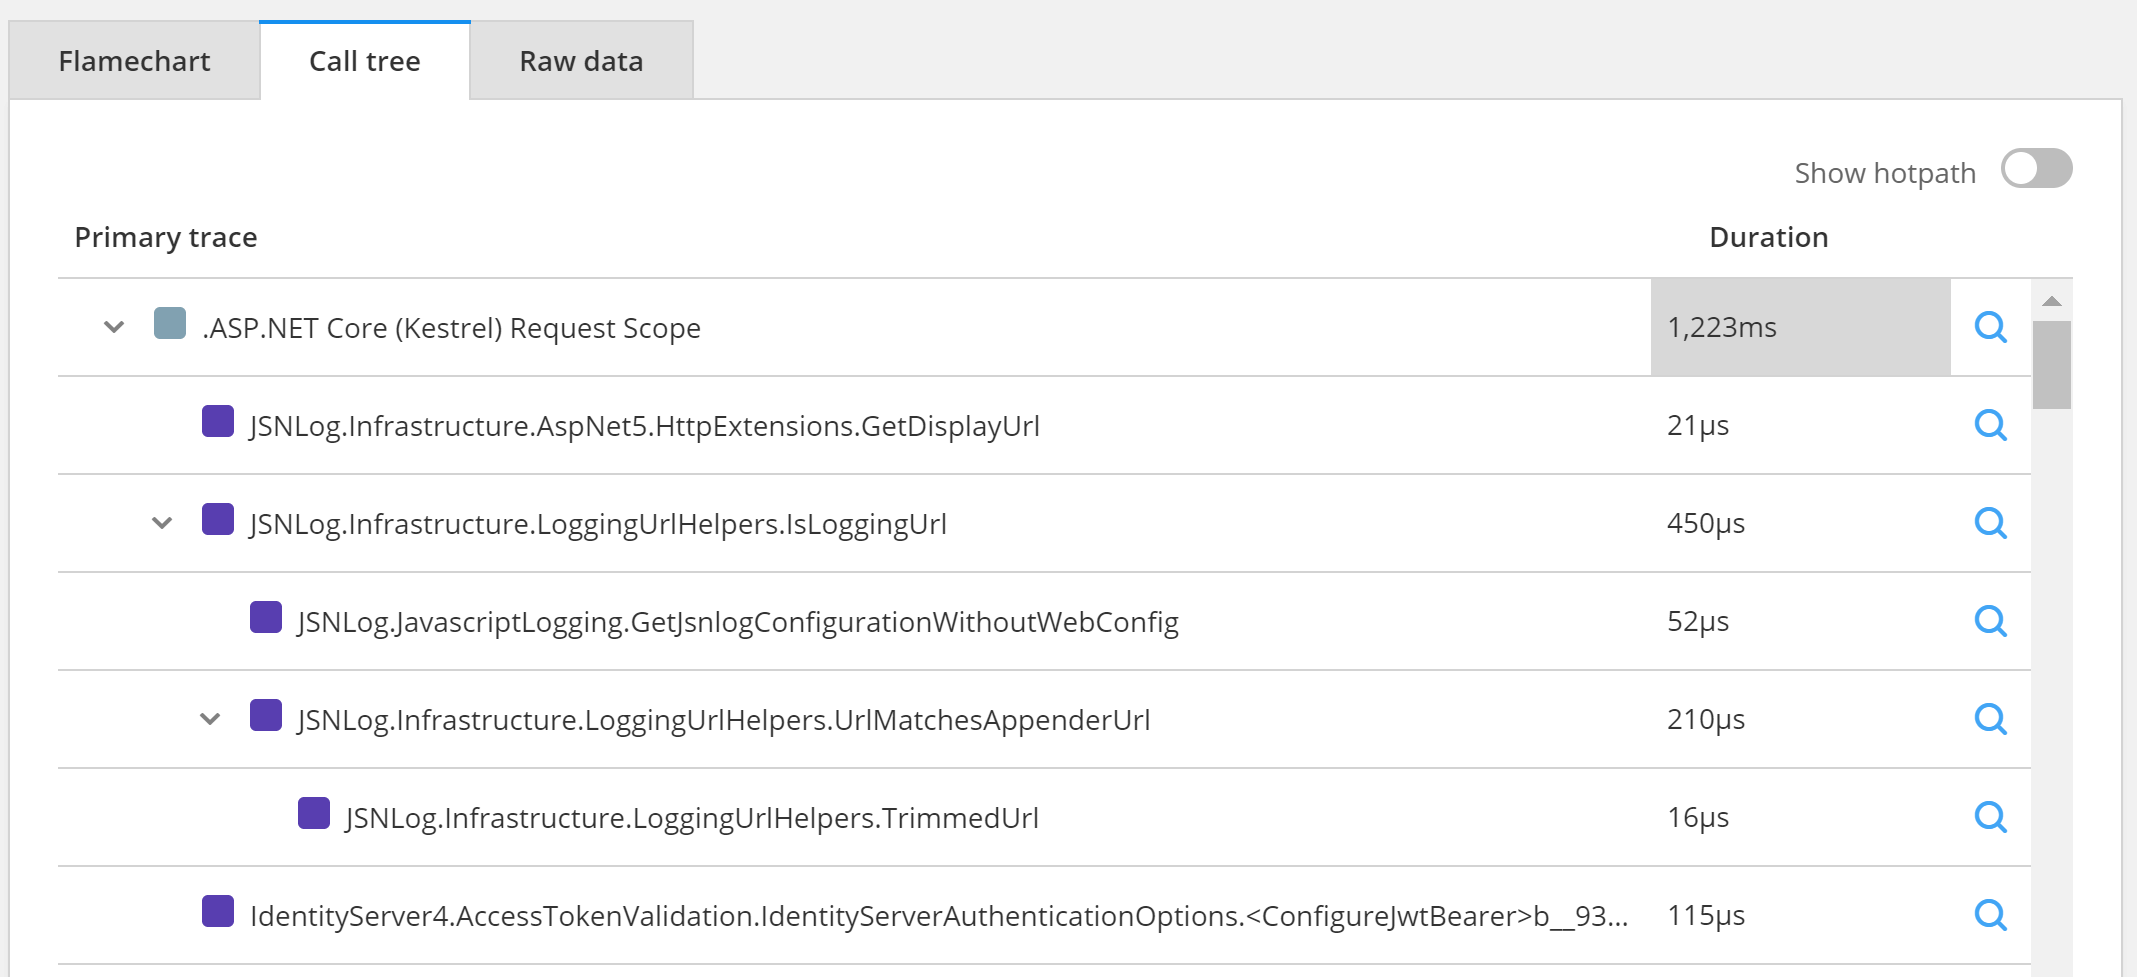
I think the flame chart is probably the most useful way to view traces like this, and one of Raygun APM's killer features. It's great to get actionable data by breaking down the metrics to the method level, which is so much more useful than many other APM tools, that only tell you overall code execution metrics. You can also view the same trace data in a more traditional "call tree" view:
Viewing traces like these is where you'll ultimately end up when you're working with APM. It's where you can actually get to the root of performance issues in your app. But an important first step is actually figuring out where to look.
Slicing your data multiple ways
As I showed earlier, the Raygun APM dashboard includes a list of the slowest requests and traces, but the "Discover" tab of the APM adds additional filtering and a more usable space for identifying issues. You can filter and sort by name, average duration, hit count, or total duration (sum of all durations).
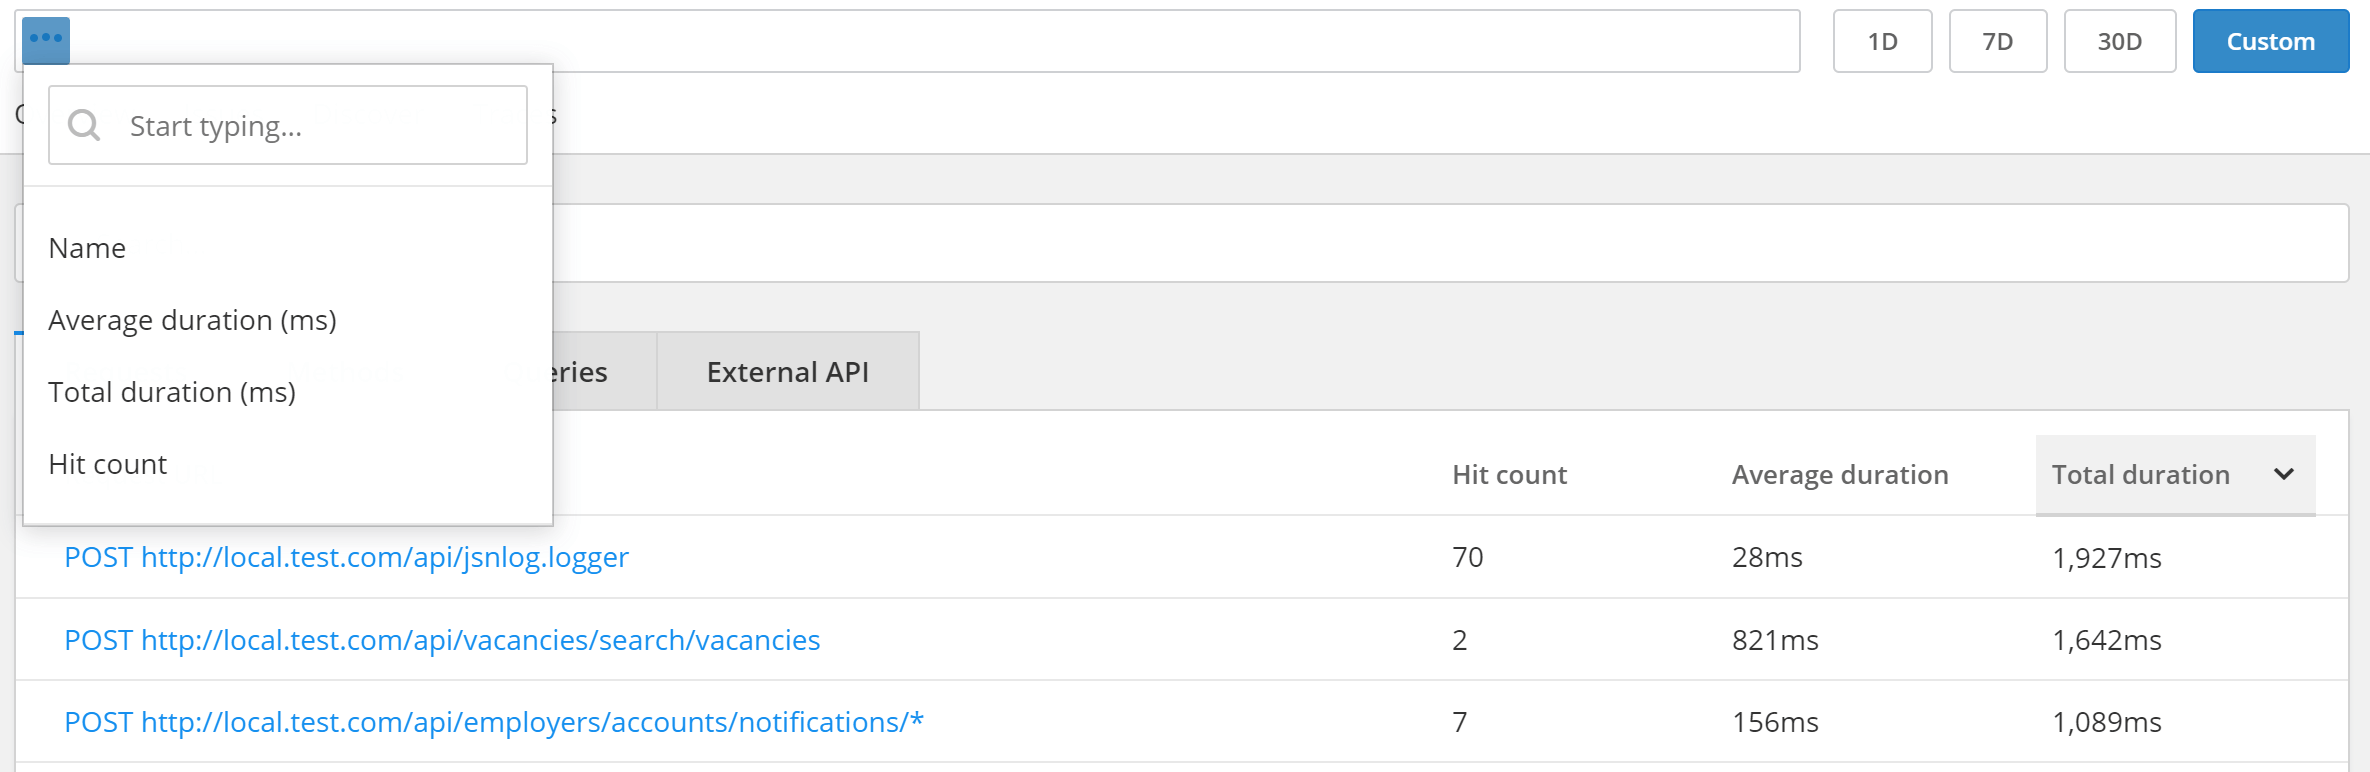
Raygun also takes care of aggregating requests with different URLs that go to the same action method, for example where you have an ID in the URL. Instead of treating these as distinct requests, Raygun replaces the id with *. It's a simple thing, but shows that there's definitely some thought gone into it, as I distinctly remember wrestling with this issue back in the day!
It's also worth mentioning that while you will only get the full flame chart trace for requests that have been sampled, you can still get aggregate results and charts for each request. Clicking on a request gives you summary statistics and request durations over time, as well as results from any captured traces that correspond to the request:
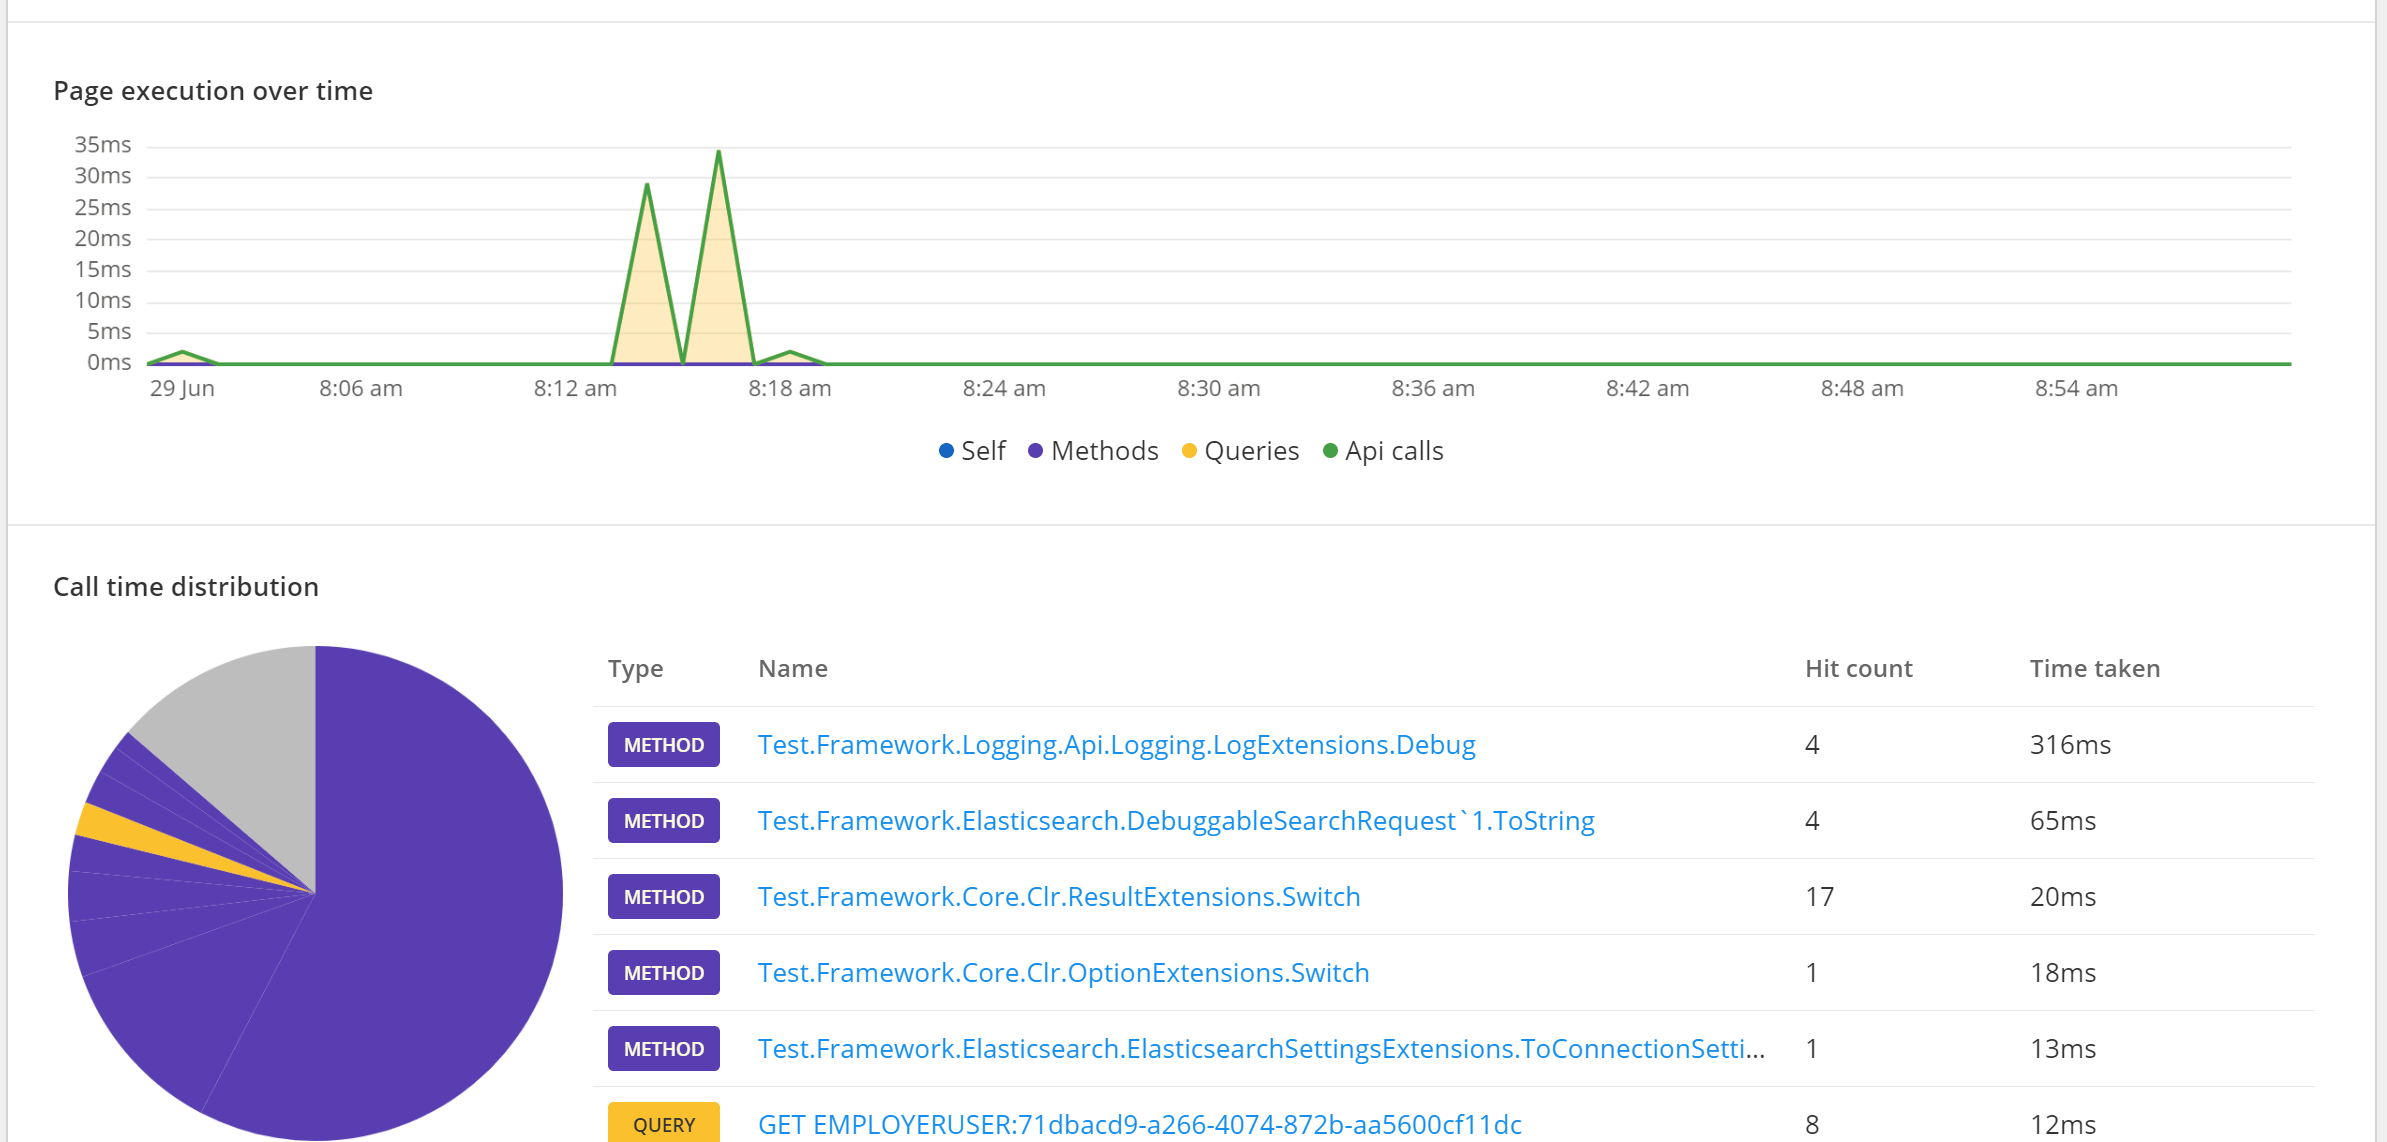
This is just a small section of the data provided, but it hopefully highlights the key features, and the fact that the UI just feels nice and intuitive from my point of view. Once you understand the difference between requests and traces, everything else follows on from there.
Like many things, if you look close enough you're bound to find issues in your app. The question is, are you looking?
Automatically creating issues to investigate
One of Raygun's selling points has been the aggregation of data that happens on their side before presenting it to you as a user. In their crash reporting tool, you can see how many people are affected by a problem, and assign people to investigate the issue.
Raygun APM uses a similar approach, by providing rules that automatically create issues when certain conditions are met. The examples below are created by default, and include common issues like chatty APIs, or slow requests.
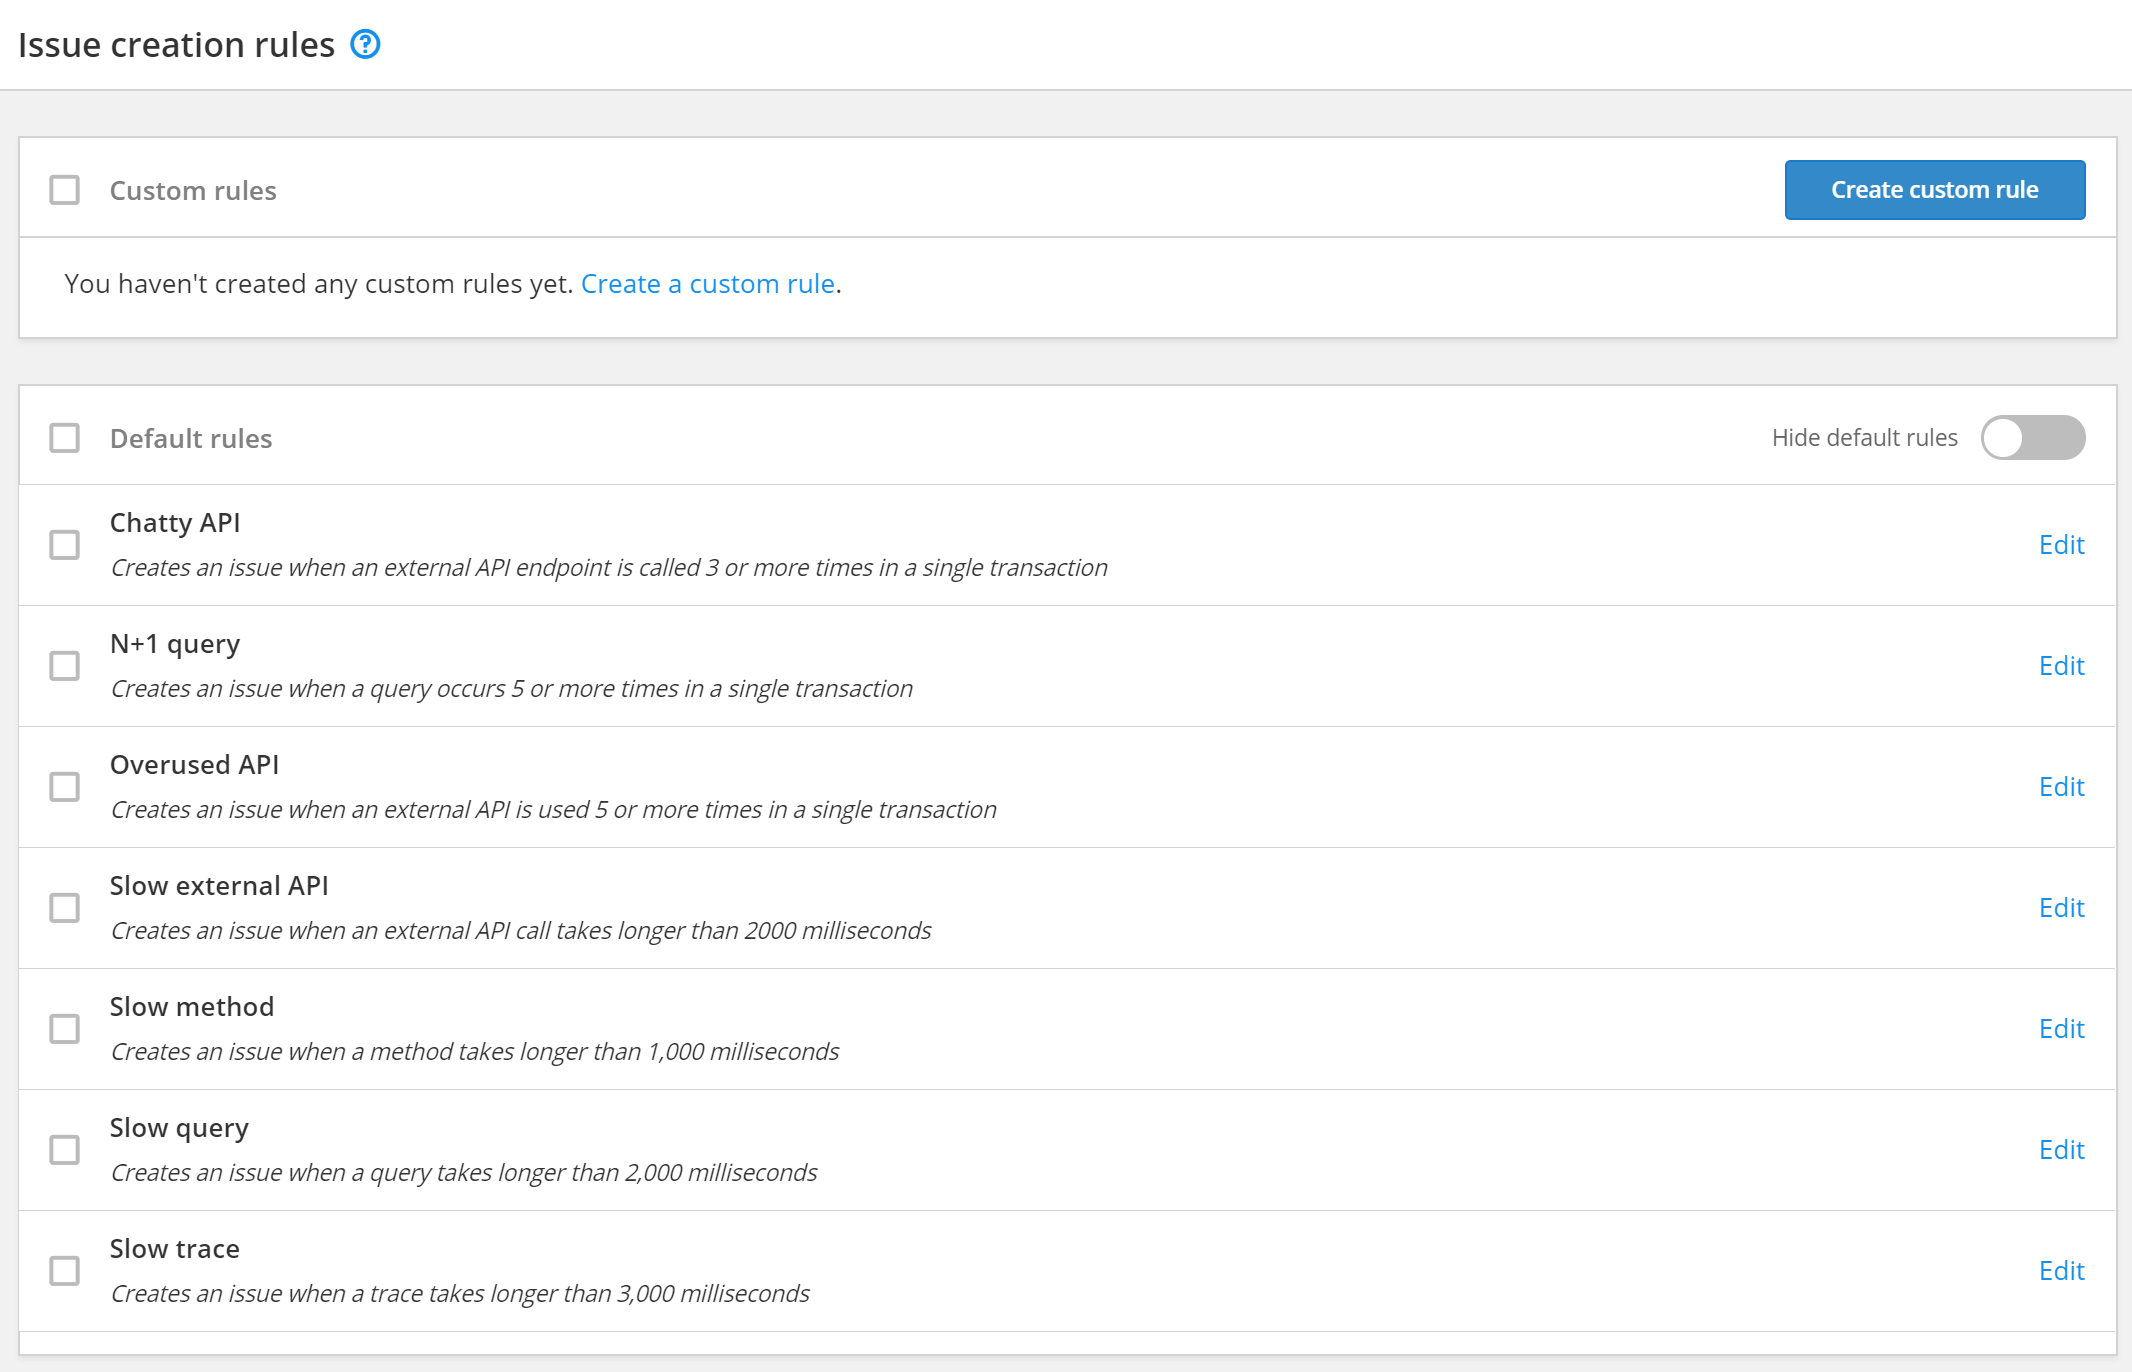
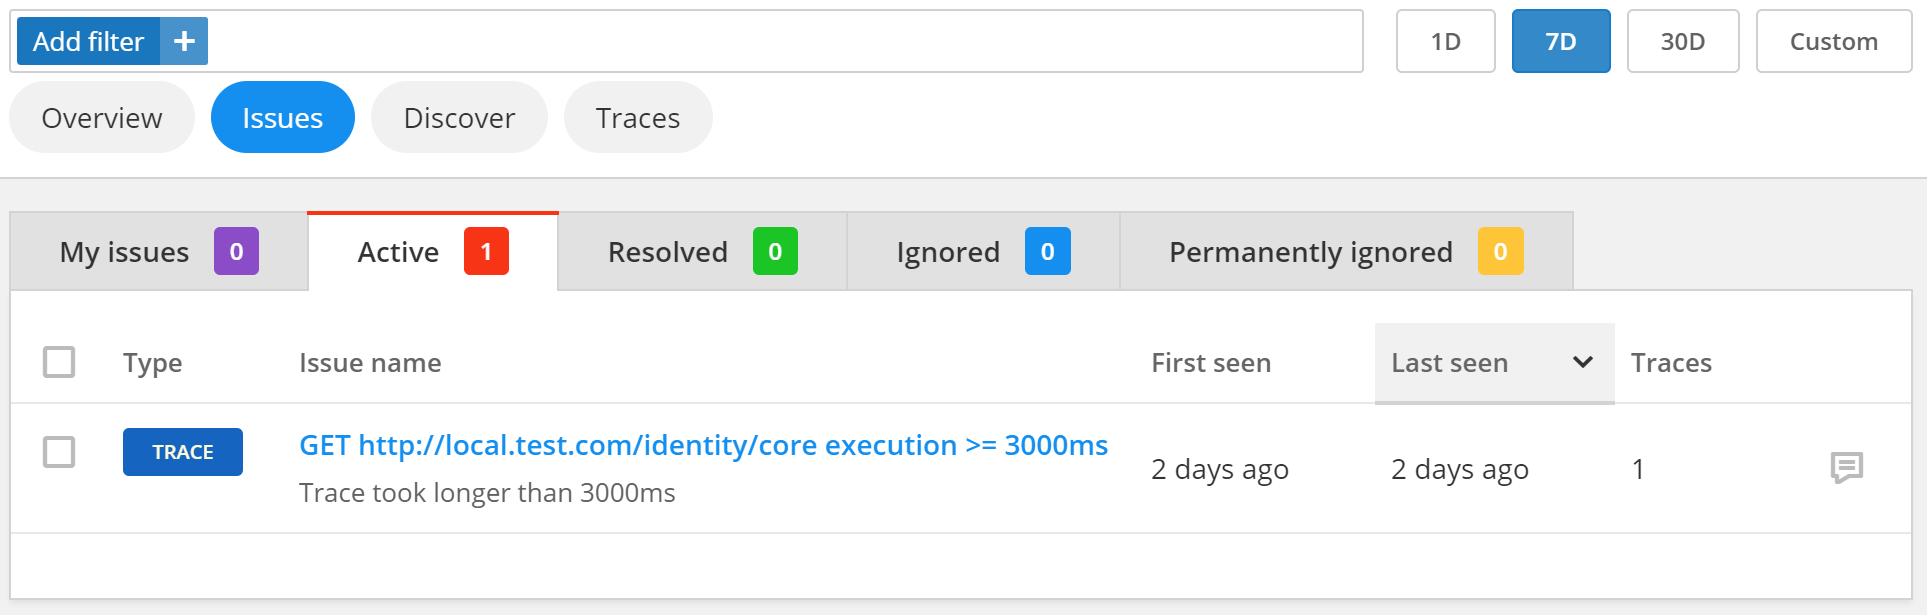
When one of these rules are hit, Raygun APM automatically creates an issue for follow up later. This should make it easier for your team to keep an eye on potential problems, especially if you use the Slack notification integration
You can edit and remove these default rules, or you can create your own rules using a combination of conditions. For example you could only create an issue if a slow request is due to slow external API call. Ultimately you have control, but I feel like tuning these rules will be key to getting the most value out of the APM.
Conclusion
Overall, I was impressed with what I saw with Raygun APM. The UI was quick and intuitive to use. I found it easy to navigate around, and understand what I was looking at, without having to dig through reams of documentation. So full marks for user experience there!
Unfortunately I can't really comment on how useful the data is at this stage, having only done local testing. From what I've seen though, it looks like it should be a useful tool for identifying problematic areas. I'm looking forward to the Linux support!
I'm sure I'll have some additional thoughts once I start using it in production, but right now there's a couple of areas that feel like they would be nice to add. The flame chart traces look great for identifying methods that need additional attention, but it feels like you may well need to run a traditional profiler on those methods to get to the bottom of why they're slow. It would be great to see memory usage for a trace, or connection leakages and other common performance problems. I'm not sure if that is even technically feasible without a significant performance impact, but a man can dream! Maybe the new runtime hooks coming in .NET Core 3.0 will help.
Summary
In this post I had my first look at the Raygun APM for .NET Core. I showed how to install the Raygun agent, how to register it, and how to register your applications with the profiler. I then explored the Raygun APM using an application I ran locally. Overall, once I was configured and ready, I found the app really easy to use and explore. The flame chart feels like the focus of the application, and for good reason; it's likely where you'll identify any issues in your apps. However, the automatic issue creation also feels like a key feature for getting the most out of the product. I'm looking forward to trying it out properly on Linux soon!
While most of my readers will be interested in the .NET Support, it's worth pointing out that Raygun have more languages on the way (Ruby on Rails, Node.js, and Java). Judging by what I've seen with .NET, they're off to a great start!