One of the great aspects of ASP.NET Core is that logging is built-in to the framework. That means you can (if you want to) get access to all the deep infrastructural logs from your own standard logging infrastructure. The down side to this is that sometimes you can get too many logs.
In this short series I describe how to use Serilog's ASP.NET Core request logging feature. In this first post I describe how to add the the Serilog RequestLoggingMiddleware to your application, and the benefits it provides. In subsequent posts I'll describe how to customise the behaviour further.
I've had these posts in draft for a while. Since then, Nicholas Blumhardt, creator of Serilog, has written a comprehensive blog post on using Serilog with ASP.NET Core 3.0. It's a very detailed (and opinionated) piece, that I strongly recommend reading. You'll find most of what I talk about in this series in his post, so check it out!
Request logging without Serilog
For this post we'll start with a basic ASP.NET Core 3.0 Razor pages app, created using dotnet new webapp. This creates a standard Program.cs that look like this:
public class Program
{
    public static void Main(string[] args)
    {
        CreateHostBuilder(args).Build().Run();
    }

    public static IHostBuilder CreateHostBuilder(string[] args) =>
        Host.CreateDefaultBuilder(args)
            .ConfigureWebHostDefaults(webBuilder =>
            {
                webBuilder.UseStartup<Startup>();
            });
}
And a Startup.cs that configures the middleware pipeline in Configure as the following:
public void Configure(IApplicationBuilder app, IWebHostEnvironment env)
{
    if (env.IsDevelopment())
    {
        app.UseDeveloperExceptionPage();
    }
    else
    {
        app.UseExceptionHandler("/Error");
        app.UseHsts();
    }

    app.UseHttpsRedirection();
    app.UseStaticFiles();
    app.UseRouting();
    app.UseAuthorization();
    app.UseEndpoints(endpoints =>
    {
        endpoints.MapRazorPages();
    });
}
If you run the application and navigate to the home page, by default you'll see a number of logs in the Console for each request. The logs below are generated for a single request to the home page (there are additional requests for CSS and JS files after this that I've not included):
info: Microsoft.AspNetCore.Hosting.Diagnostics[1]
      Request starting HTTP/2 GET https://localhost:5001/
info: Microsoft.AspNetCore.Routing.EndpointMiddleware[0]
      Executing endpoint '/Index'
info: Microsoft.AspNetCore.Mvc.RazorPages.Infrastructure.PageActionInvoker[3]
      Route matched with {page = "/Index"}. Executing page /Index
info: Microsoft.AspNetCore.Mvc.RazorPages.Infrastructure.PageActionInvoker[101]
      Executing handler method SerilogRequestLogging.Pages.IndexModel.OnGet - ModelState is Valid
info: Microsoft.AspNetCore.Mvc.RazorPages.Infrastructure.PageActionInvoker[102]
      Executed handler method OnGet, returned result .
info: Microsoft.AspNetCore.Mvc.RazorPages.Infrastructure.PageActionInvoker[103]
      Executing an implicit handler method - ModelState is Valid
info: Microsoft.AspNetCore.Mvc.RazorPages.Infrastructure.PageActionInvoker[104]
      Executed an implicit handler method, returned result Microsoft.AspNetCore.Mvc.RazorPages.PageResult.
info: Microsoft.AspNetCore.Mvc.RazorPages.Infrastructure.PageActionInvoker[4]
      Executed page /Index in 221.07510000000002ms
info: Microsoft.AspNetCore.Routing.EndpointMiddleware[1]
      Executed endpoint '/Index'
info: Microsoft.AspNetCore.Hosting.Diagnostics[2]
      Request finished in 430.9383ms 200 text/html; charset=utf-8
That's 10 logs for a single request. Now, to be clear, this was running in the Development environment, which by default logs everything in the Microsoft namespace of level "Information" or above. If we switch to the Production environment, the default template filters the logs to "Warning" for the Microsoft namespace. Navigating to the default home page now generates the following logs:
That's right, no logs at all! All of the logs generated in the previous run are in the Microsoft namespaces, and are "Information" level, so they're all filtered out. Personally I feel like that's a bit heavy handed. It would be nice if the production version logged something, for correlation with other logs if nothing else.
One possible solution is to customise the filters applied to each namespace. For example, you could limit the Microsoft.AspNetCore.Mvc.RazorPages namespace to "Warning", while leaving the more general Microsoft namespace as "Information". Now you get a reduced set of logs:
info: Microsoft.AspNetCore.Hosting.Diagnostics[1]
      Request starting HTTP/2 GET https://localhost:5001/
info: Microsoft.AspNetCore.Routing.EndpointMiddleware[0]
      Executing endpoint '/Index'
info: Microsoft.AspNetCore.Routing.EndpointMiddleware[1]
      Executed endpoint '/Index'
info: Microsoft.AspNetCore.Hosting.Diagnostics[2]
      Request finished in 184.788ms 200 text/html; charset=utf-8
These logs have some useful information in them - the URL, HTTP method, timing information, endpoint etc. - and there's not too much redundancy. But it's still slightly annoying they're four separate log messages.
This is the issue Serilog's RequestLoggingMiddleware aims to deal with - instead of creating separate logs for each step in the request, create a single "Summary" log message containing all the pertinent information.
Adding Serilog to the application
The one dependency for using Serilog's RequestLoggingMiddleware is that you're using Serilog! In this section I'll describe the basics for adding Serilog to your ASP.NET Core app. If you already have Serilog installed, skip to the next section.
I described how to add Serilog to a generic host application over a year ago, and with ASP.NET Core now re-platformed on top of the generic host infrastructure the setup for ASP.NET Core 3.0 is very similar. The approach described in this post follows the suggestions + advice of the Serilog.AspNetCore GitHub repository (and the advice from Nicholas Blumhardt's post too).
Start by installing the Serilog.AspNetCore NuGet package, plus the Console and Seq Sinks, so that we can view the logs. You can do this from the command line by running:
dotnet add package Serilog.AspNetCore
dotnet add package Serilog.Sinks.Console
dotnet add package Serilog.Sinks.Seq
Now it's time to replace the default logging with Serilog. There's a number of ways you can do this, but the suggested approach is to configure your logger in Program.Main before you do anything else. This goes against the approach used by ASP.NET Core in general, but is the approach suggested for Serilog. The result is that your Program.cs file becomes rather longer:
// Additional required namespaces
using Serilog;
using Serilog.Events;

public class Program
{
    public static int Main(string[] args)
    {
        // Create the Serilog logger, and configure the sinks
        Log.Logger = new LoggerConfiguration()
            .MinimumLevel.Debug()
            .MinimumLevel.Override("Microsoft", LogEventLevel.Information)
            .Enrich.FromLogContext()
            .WriteTo.Console()
            .WriteTo.Seq("http://localhost:5341")
            .CreateLogger();

        // Wrap creating and running the host in a try-catch block
        try
        {
            Log.Information("Starting host");
            CreateHostBuilder(args).Build().Run();
            return 0;
        }
        catch (Exception ex)
        {
            Log.Fatal(ex, "Host terminated unexpectedly");
            return 1;
        }
        finally
        {
            Log.CloseAndFlush();
        }
    }

    public static IHostBuilder CreateHostBuilder(string[] args) =>
        Host.CreateDefaultBuilder(args)
            .UseSerilog() // <- Add this line
            .ConfigureWebHostDefaults(webBuilder =>
            {
                webBuilder.UseStartup<Startup>();
            });
}
While more complex, this setup ensures that you will still get logs if your appsettings.json file is formatted incorrectly, or configuration files are missing, for example. If you run your application now you'll see the same 10 logs we did originally, just formatted slightly differently:
[13:30:27 INF] Request starting HTTP/2 GET https://localhost:5001/
[13:30:27 INF] Executing endpoint '/Index'
[13:30:27 INF] Route matched with {page = "/Index"}. Executing page /Index
[13:30:27 INF] Executing handler method SerilogRequestLogging.Pages.IndexModel.OnGet - ModelState is Valid
[13:30:27 INF] Executed handler method OnGet, returned result .
[13:30:27 INF] Executing an implicit handler method - ModelState is Valid
[13:30:27 INF] Executed an implicit handler method, returned result Microsoft.AspNetCore.Mvc.RazorPages.PageResult.
[13:30:27 INF] Executed page /Index in 168.28470000000002ms
[13:30:27 INF] Executed endpoint '/Index'
[13:30:27 INF] Request finished in 297.0663ms 200 text/html; charset=utf-8
We seem to have taken 2 steps forward and one step back here. Our logging configuration is more robust now by configuring it earlier in the application lifecycle, but we haven't actually solved the problem we set out to yet. To do that we'll add the RequestLoggingMiddleware.
Switching to Serilog's RequestLoggingMiddleware
The RequestLoggingMiddleware is included in the Serilog.AspNetCore package and can be used to add a single "summary" log message for each request. If you've already gone through the steps in the previous section, adding the middleware is simple. In your Startup class, call UseSerilogRequestLogging() at the point where you would like to record the logs:
// Additional required namespace
using Serilog;

public void Configure(IApplicationBuilder app, IWebHostEnvironment env)
{
    // ... Error handling/HTTPS middleware
    app.UseStaticFiles();

    app.UseSerilogRequestLogging(); // <-- Add this line

    app.UseRouting();
    app.UseAuthorization();
    app.UseEndpoints(endpoints =>
    {
        endpoints.MapRazorPages();
    });
}
As always with the ASP.NET Core middleware pipeline, order is important. When a request reaches the RequestLoggingMiddleware the middleware starts a timer, and passes the request on for handling by subsequent middleware. When a later middleware eventually generates a response (or throws an exception), the response passes back through the middleware pipeline to the request logger, which records the result and writes a summary log message.
Serilog can only log requests that reach the middleware. In the example above, I've added the RequestLoggingMiddleware after the StaticFilesMiddleware. Requests that are handled by UseStaticFiles will short-circuit the pipeline, and won't be logged. Given the static files middleware is quite noisy that will often be the desired behaviour, but if you wish to log requests for static files too, you can move the serilog middleware earlier in the pipeline.
If we run the application one more time, you'll still see the original 10 log messages, but you'll see an additional log message from the Serilog RequestLoggingMiddleware, the penultimate message:
# Standard logging from ASP.NET Core infrastructure
[14:15:44 INF] Request starting HTTP/2 GET https://localhost:5001/
[14:15:44 INF] Executing endpoint '/Index'
[14:15:45 INF] Route matched with {page = "/Index"}. Executing page /Index
[14:15:45 INF] Executing handler method SerilogRequestLogging.Pages.IndexModel.OnGet - ModelState is Valid
[14:15:45 INF] Executed handler method OnGet, returned result .
[14:15:45 INF] Executing an implicit handler method - ModelState is Valid
[14:15:45 INF] Executed an implicit handler method, returned result Microsoft.AspNetCore.Mvc.RazorPages.PageResult.
[14:15:45 INF] Executed page /Index in 124.7462ms
[14:15:45 INF] Executed endpoint '/Index'

# Additional Log from Serilog
[14:15:45 INF] HTTP GET / responded 200 in 249.6985 ms

# Standard logging from ASP.NET Core infrastructure
[14:15:45 INF] Request finished in 274.283ms 200 text/html; charset=utf-8
There's a couple of things to note about this log:
- It includes most of the pertinent information you'd want in a single message - HTTP method, URL Path, Status Code, duration.
- The duration shown is slightly shorter than the value logged by Kestrel on the subsequent message. That's to be expected, as Serilog only starts timing when the request reaches its middleware, and stops timing when it returns (after generating a response).
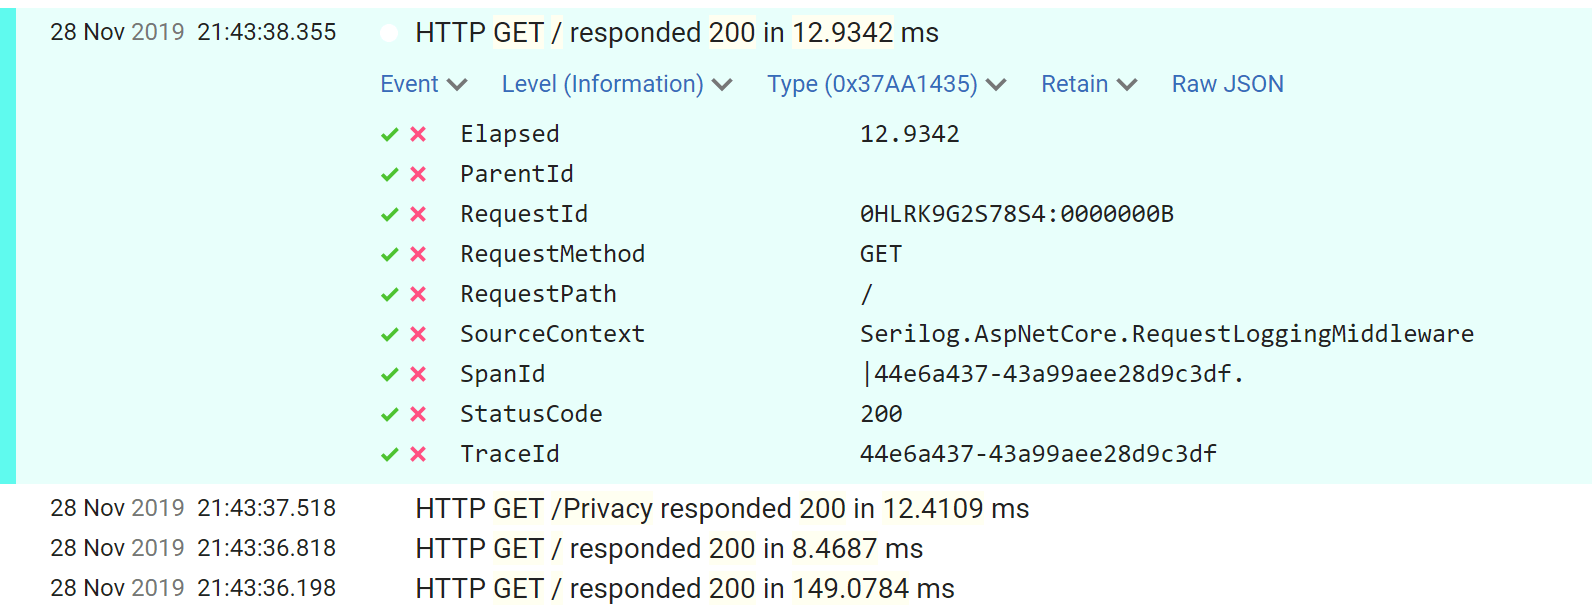
- In both cases, additional values are logged when you use structural logging. For example, the RequestId and SpanId (used for tracing capabilities) are logged as they are part of the logging scope. You can see this in the following image of the request logged to seq.
- We do lose some information by default. For example, the endpoint name and Razor page handler are no longer logged. In subsequent posts I'll show how to add these to the summary log.
All that remains to finish tidying things up is to filter out the Information-level log messages we're currently logging. Update your Serilog configuration in Program.cs to add the extra filter:
Log.Logger = new LoggerConfiguration()
    .MinimumLevel.Debug()
    .MinimumLevel.Override("Microsoft", LogEventLevel.Information)
    // Filter out ASP.NET Core infrastructre logs that are Information and below
    .MinimumLevel.Override("Microsoft.AspNetCore", LogEventLevel.Warning)
    .Enrich.FromLogContext()
    .WriteTo.Console()
    .WriteTo.Seq("http://localhost:5341")
    .CreateLogger();
With this final change, you'll now get a clean set of request logs containing summary data for each request:
[14:29:53 INF] HTTP GET / responded 200 in 129.9509 ms
[14:29:56 INF] HTTP GET /Privacy responded 200 in 10.0724 ms
[14:29:57 INF] HTTP GET / responded 200 in 3.3341 ms
[14:30:54 INF] HTTP GET /Missing responded 404 in 16.7119 ms
In the next post I'll look at how we can enhance this log by recording additional data.
Summary
In this post I described how you can use Serilog.AspNetCore's request logging middleware to reduce the number of logs generated for each ASP.NET Core request, while still recording summary data. If you're already using Serilog, this is very easy to enable. Simply call UseSerilogRequestLogging() in your Startup.cs file.
When a request reaches this middleware it will start a timer. When subsequent middleware generates a response (or throws an exception) the response passes back through the request logger, which records the result and writes a summary log message.
After adding the request logging middleware you can filter out more of the infrastructural logs generated by default in ASP.NET Core 3.0, without losing useful information.