In previous posts in this series you've seen how to deploy an ASP.NET Core application to Kubernetes using Helm, and how to configure your applications by injecting environment variables.
In this post I'm going to talk about a crucial part of Kubernetes—health checks. Health checks indicate when your application has crashed and when it is ready to receive traffic, and they're a crucial part of how Kubernetes manages your application.
In this post I'll discuss how Kubernetes uses health checks to control deployments, and how to add them to your ASP.NET Core applications. I'll also discuss "smart" vs "dumb" health checks, which ones I think you should use, and one of the gotchas that tripped me up when I started deploying to Kubernetes.
Kubernetes deployments and probes
As I discussed in the first post in this series, Kubernetes is an orchestrator for your Docker containers. You tell it which containers you want to run in a pod, and how many replicas of the pod it should create by creating a Deployment resource. Kubernetes tries to ensure there's always the required number of instances of your pod running in the cluster by starting up new instances as required.
Kubernetes obviously can tell how many instances of your pod it's running, but it also needs to know if your application has crashed, or if it has deadlocked. If it detects a crash, then it will stop the pod and start up a new one to replace it.
But how does Kubernetes know if your app has crashed/deadlocked? Sure, if the process dies, that's easy; Kubernetes will automatically spin up another instance. But what about the more subtle cases:
- The process hasn't completely crashed, but it's deadlocked and not running any more
- The application isn't technically deadlocked, but it can't handle any requests
Kubernetes achieves this using probes.
The three kinds of probe: Liveness, Readiness, and Startup probes
Kubernetes (since version 1.16) has three types of probe, which are used for three different purposes:
- Liveness probe. This is for detecting whether the application process has crashed/deadlocked. If a liveness probe fails, Kubernetes will stop the pod, and create a new one.
- Readiness probe. This is for detecting whether the application is ready to handle requests. If a readiness probe fails, Kubernetes will leave the pod running, but won't send any requests to the pod.
- Startup probe. This is used when the container starts up, to indicate that it's ready. Once the startup probe succeeds, Kubernetes switches to using the liveness probe to determine if the application is alive. This probe was introduced in Kubernetes version 1.16.
To add some context, in most applications a "probe" is an HTTP endpoint. If the endpoint returns a status code from
200to399, the probe is successful. Anything else is considered a failure. There are other types of probe (TCP/generic command) but I'm not going to cover those in this post.
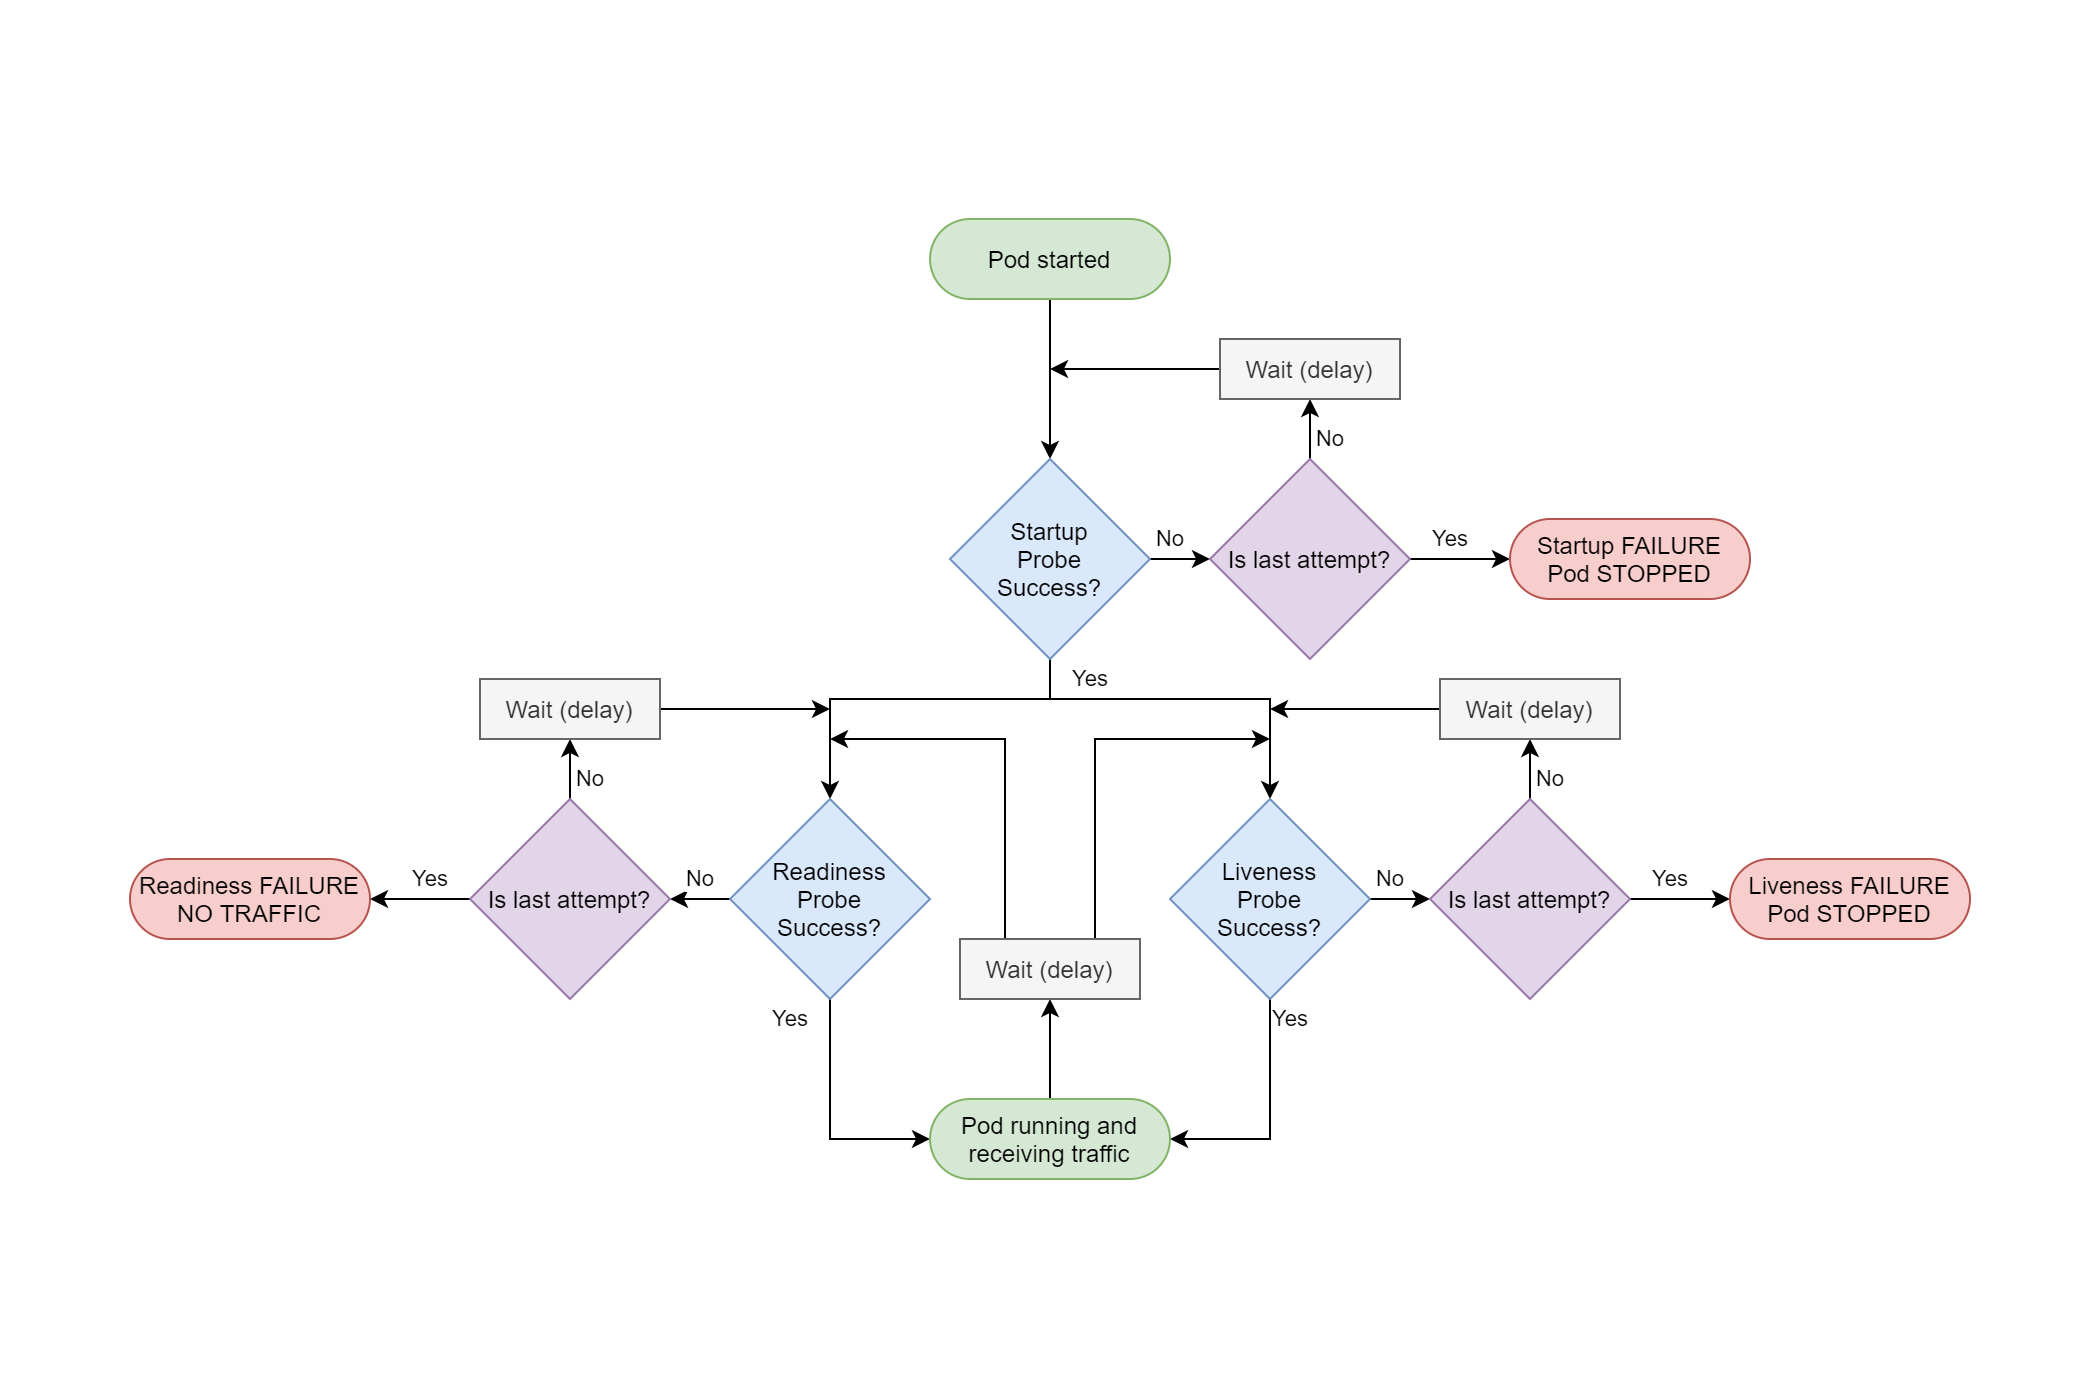
Having three different types of probe might seem a bit over the top, but they do subtly different things. If flow charts are your thing, this is an overview of the interplay between them:

We'll look at each of these probes in turn.
Startup probes
The first probe to run is the Startup probe. When your app starts up, it might need to do a lot of work. It might need to fetch data from remote services, load dlls from plugins, who knows what else. During that process, your app should either not respond to requests, or if it does, it should return a status code of 400 or higher. Once the startup process has finished, you can switch to returning a success result (200) for the startup probe.
As soon as the startup probe succeeds once it never runs again for the lifetime of that container. If the startup probe never succeeds, Kubernetes will eventually kill the container, and restart the pod.
Startup probes are defined in your deployment.yaml manifest. For example, the following shows the spec:template: section for a deployment.yaml that contains a startup probe. The probe is defined in startupProbe, and calls the URL /health/startup on port 80. It also states the probe should be tried 30 times before failing, with a wait period of 10s between checks.
apiVersion: apps/v1
kind: Deployment
metadata:
  name: test-app-api-deployment
spec:
  template:
    metadata:
      labels:
        app: test-app-api
    spec:
      containers:
      - name: test-app-api
        image: andrewlock/my-test-api:0.1.1
        startupProbe:
          httpGet:
            path: /health/startup
            port: 80
          failureThreshold: 30
          periodSeconds: 10
You can add more configuration to the HTTP probe, such as specifying that HTTPS should be used and custom headers to add. You can also add additional configuration around the probe limits, such as requiring multiple successful attempts before the probe is configured "successful".
Once the startup probe succeeds, Kubernetes starts the liveness and readiness probes.
Liveness probes
The liveness probe is what you might expect—it indicates whether the container is alive or not. If a container fails its liveness probe, Kubernetes will kill the pod and restart another.
If you have multiple containers in a pod, then if any of the containers fail their liveness probes then the whole pod is killed and restarted.
Liveness probes are defined in virtually the same way as startup probes, in deployment.yaml. The following shows an HTTP liveness probe that calls the path /healthz on port 80.
apiVersion: apps/v1
kind: Deployment
metadata:
  name: test-app-api-deployment
spec:
  template:
    metadata:
      labels:
        app: test-app-api
    spec:
      containers:
      - name: test-app-api
        image: andrewlock/my-test-api:0.1.1
        livenessProbe:
          httpGet:
            path: /healthz
            port: 80
          initialDelaySeconds: 0
          periodSeconds: 10
          timeoutSeconds: 1
          failureThreshold: 3
The specification above shows some additional configuration values (the default values). initialDelaySeconds controls whether liveness checks start immediately, and periodSeconds defines the waiting period between checks. timeoutSeconds is how long before a request times out if your application isn't handling requests, and failureThreshold is the number of times a request can fail before the probe is considered "failed". Based on the configuration provided, that means if a pod isn't handling requests, it will take approximately 30s (periodSeconds × failureThreshold) before Kubernetes restarts the pod.
As you might expect, liveness probes happen continually through the lifetime of your app. If your app stops responding at some point, Kubernetes will kill it and start a new instance of the pod.
Readiness probes
Readiness probes indicate whether your application is ready to handle requests. It could be that your application is alive, but that it just can't handle HTTP traffic. In that case, Kubernetes won't kill the container, but it will stop sending it requests. In practical terms, that means the pod is removed from an associated service's "pool" of pods that are handling requests, by marking the pod as "Unready".
Readiness probes are defined in much the same way as startup and liveness probes:
apiVersion: apps/v1
kind: Deployment
metadata:
  name: test-app-api-deployment
spec:
  template:
    metadata:
      labels:
        app: test-app-api
    spec:
      containers:
      - name: test-app-api
        image: andrewlock/my-test-api:0.1.1
        readinessProbe:
          httpGet:
            path: /ready
            port: 80
          successThreshold: 3
Configuration settings are similar for readiness probes, though you can also set the successThreshold, which is the number of consecutive times a request must be successful after a failure before the probe is considered successful.
An important point about readiness probes, which is often overlooked, is that readiness probes happen continually through the lifetime of your app, exactly the same as for liveness probes. We'll come back to this shortly, but for now, lets add some endpoints to our test application to act as probes.
Health checks in ASP.NET Core
ASP.NET Core introduced health checks in .NET Core 2.2. This provides a number of services and helper endpoints to expose the state of your application to outside services. For this post, I'm going to assume you have some familiarity with ASP.NET Core's health checks, and just give a brief overview here.
Jürgen Gutsch has a great look at Health Checks in ASP.NET Core here.
If you're adding health checks to an ASP.NET Core application, I strongly suggest looking at AspNetCore.Diagnostics.HealthChecks by the folks at Xabaril. They have a huge number of health checks available for checking that your app can connect to your database, message bus, Redis, Elasticsearch; you name it, they have a check for it!
Despite that, just for demonstration purposes, I'm going to create a very simple custom health check for our application. It's not going to be especially useful, but it shows how you can create your own IHealthCheck implementations. I'll also use it to demonstrate a separate point later.
Creating a custom health check
To create a custom HealthCheck, you should implement IHealthCheck in the namespace Microsoft.Extensions.Diagnostics.HealthChecks. The example below simply returns a healthy or unhealthy result based on a random number generator. This check only returns healthy 1/5 times, the rest of the time it returns unhealthy.
public class RandomHealthCheck : IHealthCheck
{
    private static readonly Random _rnd = new Random();

    public Task<HealthCheckResult> CheckHealthAsync(HealthCheckContext context, CancellationToken cancellationToken = default)
    {
        var result = _rnd.Next(5) == 0
            ? HealthCheckResult.Healthy()
            : HealthCheckResult.Unhealthy("Failed random");

        return Task.FromResult(result);
    }
}
There's a couple of things to note here:
- The method can be
async, though I don't need that for this example. - You can return extra data in both the
HealthyandUnhealthycheck results such as a description,Exception, or arbitrary extra data. This can be very useful for building dashboards, such as the Health Checks UI, also from Xabaril.
You can register the service in Startup.ConfigureServices() when you add the health check services to your application, giving the check a name e.g. "Main database", "Redis cache", or, in this case "Random check":
public void ConfigureServices(IServiceCollection services)
{
    services.AddHealthChecks()
        .AddCheck<RandomHealthCheck>("Random check");

    services.AddControllers(); // Existing configuration
}
Now we need to add health check endpoints for the various probes. As an example, I'm going to add separate endpoints for each probe, using the paths defined earlier in this post.
public void Configure(IApplicationBuilder app, IWebHostEnvironment env)
{
    app.UseHttpsRedirection();
    app.UseRouting();
    app.UseAuthorization();

    app.UseEndpoints(endpoints =>
    {
        endpoints.MapHealthChecks("/health/startup");
        endpoints.MapHealthChecks("/healthz");
        endpoints.MapHealthChecks("/ready");
        endpoints.MapControllers();
    });
}
When you hit any of these endpoints, the configured health checks are executed, and will return either a Healthy or Unhealthy result. If the checks are healthy, ASP.NET Core will return a 200 result, which will cause the probe to succeed. If any of the checks fail, we return a 503 result, and the probe will fail.
You can test these health checks locally. Run the application, hit one of the health check endpoints, and keep refreshing. You'll see the response switch between healthy and unhealthy.
It's important to remember that endpoints only execute after everything earlier in the middleware pipeline. In the code above, the
HttpsRedirectionmiddleware will cause non-HTTPS endpoints to return a307 Temporary Redirect, which will be seen as a success by the probe.
The health check I've created is obviously not very useful, but it brings us to the crux of a somewhat philosophical question: when do we want our health checks to fail?
Smart vs Dumb health checks
That might seem like a silly question. If we have a health check for checking our app can connect to the database, then if that check fails, the health check should fail right? Well, not necessarily.
Imagine you have many services, all running in Kubernetes, and which have some dependencies on each other.
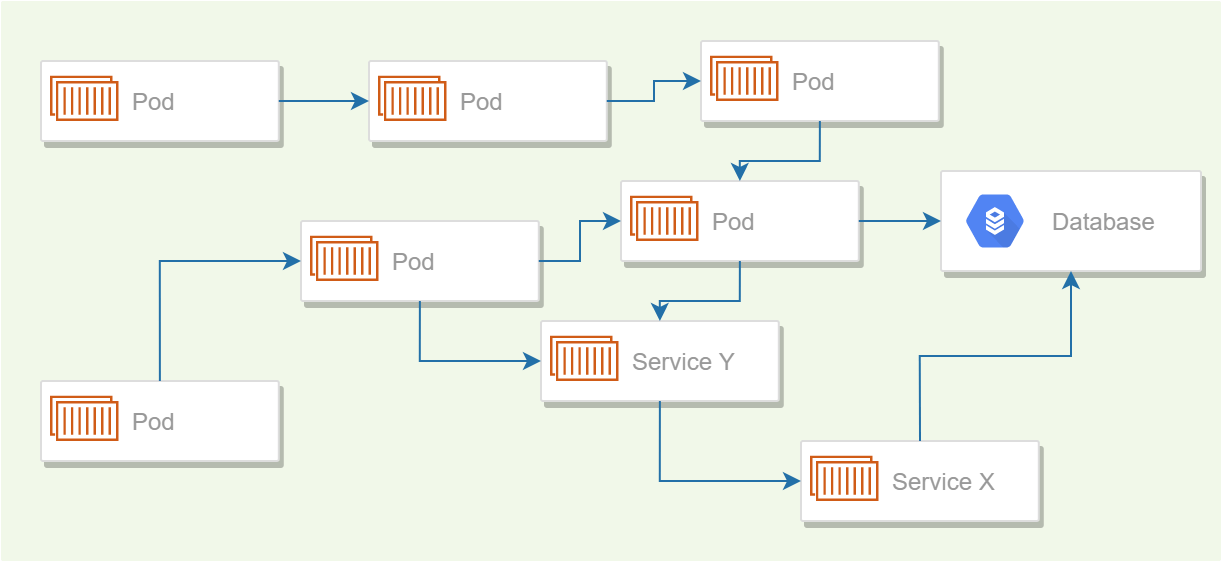
Having your services so directly dependent on one another, rather than indirectly connected via a message bus or broker is probably a bad idea, but also probably not that unusual. This is obviously an oversimplified example, to get the point across.
For simplicity, lets also imagine that each service contains a single liveness probe which verifies that a service can connect to all the other services it depends on.
Now imagine the network connection between "Service X" (bottom right) and the database has a blip, and the app loses connectivity. This happens for about 30s, before the connection re-establishes itself.
However, that 30s is sufficient for the liveness probe to fail, and for Kubernetes to restart the application. But now Service Y can't connect to Service X, so its liveness probe fails too, and k8s restarts that one. Continue the pattern, and you've got a cascading failure across all your services, caused by a blip in connectivity in just one service, even though most of the services don't depend on the service that failed (the database).
There's generally two different approaches to how to design your probes:
- Smart probes typically aim to verify the application is working correctly, that it can service requests, and that it can connect to its dependencies (a database, message queue, or other API, for example).
- Dumb health checks typically only indicate the application has not crashed. They don't check that the application can connect to its dependencies, and often only exercise the most basic requirements of the application itself i.e. can they respond to an HTTP request.
On the face of it, smart health checks seem like the "better" option, as they give a much better indication that your application is working correctly. But they can be dangerous, as you've seen. So how do we strike that balance?
Dumb liveness checks, smart startup checks
The approach I favour is:
- Use dumb liveness probes
- Use smart startup probes
- Readiness probes…we'll get to them shortly
For liveness checks, dumb health checks definitely seem like the way to go. You can argue how dumb, but fundamentally you just want to know whether the application is alive. Think of it like a "restart me now" flag. If restarting the app won't "fix" the health check, it probably shouldn't be in the liveness check. For the most part, that means if Kestrel can handle the request, the health check should pass.
For startup checks, I take the opposite approach. This is where I do all my due-diligence for the application: check you can connect to the database or to a message bus, and that the app's configuration is valid.
Generally speaking startup is also the best and safest time to do these checks. In my experience, failures are most often due to a configuration change—when you're deploying in Kubernetes that's invariably due to a configuration error. Checking this once at startup is the best place for it.
This can still lead to issues if your services rely on the health of other services. If you need to do a big redeploy for some reason, you can get "stuck" where every service is waiting for another one. This normally points to a problem in your application architecture,and should probably be addressed, but it's something to watch out for.
So that brings us to readiness checks. And honestly, I don't know what to suggest. For most API applications I struggle to think of a situation where the application is still alive and handling requests (as checked by the liveness probe), has finished its startup checks (as checked by the startup probe), but shouldn't be receiving traffic (which would be indicated by the readiness probe). The main candidate situation would be where the app is overloaded with requests, and needs to process them, but personally that's not a situation I've had to handle in this way.
As I've already described, we probably shouldn't be checking the availability of our dependencies in readiness checks due to the potential for cascading failures. You could take applications out of circulation based on CPU utilization or RPS, but that seems very fragile to me. On top of that, readiness probes are executed throughout the lifetime of the application, so they shouldn't be heavy or they'll be adding unnecessary load to the app itself.
I'd be interested to know what people are checking their readiness checks so please let me know in the comments!
So now we know what we want—dumb liveness checks and smart startup checks—let's update our application's implementation.
Executing a subset of health checks in a health check endpoint
For our liveness probe we only want to do the bare minimum of checks. You can still use the health check endpoint for this, as the MapHealthChecks() method has an overload that allows you to pass a predicate for whether a health check should be executed. We simply pass a predicate which always returns false, so the RandomHealthCheck we registered won't be executed.
public void Configure(IApplicationBuilder app, IWebHostEnvironment env)
{
    app.UseHttpsRedirection();
    app.UseRouting();
    app.UseAuthorization();

    app.UseEndpoints(endpoints =>
    {
        endpoints.MapHealthChecks("/health/startup");
        endpoints.MapHealthChecks("/healthz", new HealthCheckOptions { Predicate = _ => false });
        endpoints.MapHealthChecks("/ready", new HealthCheckOptions { Predicate = _ => false });
        endpoints.MapControllers();
    });
}
I've also added the predicate to the /ready endpoint, so that we still expose a readiness probe, but we could feasibly omit that, given a failure here will cause the liveness probe to fail anyway.
If we deploy our helm chart to Kubernetes, we might find it takes a little longer for our services to be ready, while we wait for the RandomHealthCheck to return Healthy (simulating real health checks you might run on startup). Once the app is deployed however, it will remain available as long as Kestrel doesn't outright crash! Which means forever 😉
Summary
In this post I described why Kubernetes uses health check probes and the three types of probe available. I showed how to configure these in your deployment.yaml and what each probe is for. I also showed how to create a custom health check, how to register it in your application and expose health check endpoints.
When creating health checks you have the option of creating "smart" health checks, that check that an app is perfectly healthy, including all its dependencies, or "dumb" health checks, that check the application simply hasn't crashed. I suggest you use smart health checks for your startup probe, primarily to catch configuration errors. I suggest you use dumb health checks for liveness probes, to avoid cascading failures.